Journal of Korean Society of Forest Science
Korean Society of Forest Science
Article

Quantifying Litterfall Input from the Stand Parameters of Korean Red Pine (Pinus densiflora S. et Z.) Stands in Gyeongnam Province

Choonsig Kim1,*https://orcid.org/0000-0002-3263-1187, Gyeongwon Baek1, Byeonggil Choi1, Gyeongrin Baek1, Hojin Kim1
1Department of Forest Resources, Gyeongsang National University, Jinju 52725, Korea
*Corresponding Author : E-mail: ckim@gnu.ac.kr

© Copyright 2021 Korean Society of Forest Science. This is an Open-Access article distributed under the terms of the Creative Commons Attribution Non-Commercial License (http://creativecommons.org/licenses/by-nc/4.0/) which permits unrestricted non-commercial use, distribution, and reproduction in any medium, provided the original work is properly cited.

Received: Oct 08, 2021; Revised: Nov 30, 2021; Accepted: Dec 01, 2021

Published Online: Dec 31, 2021

Abstract

This study developed an estimation model for litterfall input using the stand parameters (basal area, stand density, mean DBH, and carbon stocks of the aboveground tree biomass) collected from the Korean red pine (Pinus densiflora S. et Z.) stands of seven regions in Gyeongsangnam-do. The mean annual litterfall was 2,779 kg ha−1 year−1 for needles, 883 kg ha−1 year−1 for miscellaneous, 611 kg ha−1 year−1 for broadleaved, 513 kg ha−1 year−1 for branches, and 340 kg ha−1 year−1 for bark litter. The mean annual total litterfall was 5,051 kg ha−1 year−1. Litterfall components were significantly correlated with stand parameters, except for broadleaved litter. A stronger correlation was observed between the carbon stock of the aboveground tree biomass and all the litterfall components compared with the other stand variables. The allometric equations for all the litterfall components were significant (P < 0.05), with the stand parameters accounting for 5%‒43% and 8%‒42% of the variation in the needle litter and total litterfall, respectively. The results indicated that the annual litterfall inputs of the Korean red pine stands on a regional scale can be effectively estimated by allometric equations using the basal area and carbon stocks of the aboveground tree biomass.

Keywords: allometric models; carbon cycling; forest soil; litterfall; red pine; nutrient cycling

Introduction

Litterfall inputs are a key parameter for measuring, modeling, and estimating soil carbon sequestration, nutrient cycles, and nutrient flows in forest stands (Berg and Laskowski, 2006; Kim et al., 2012; Lado-Monserrat et al., 2016). Thus, litterfall inputs have received considerable research attention at stand (Kim et al., 2012), regional (Lehtonen et al., 2004; Starr et al., 2005; Erkan et al., 2017), continental (Neumann et al., 2018), and global scales (Li et al., 2019). Many studies have developed statistical models to identify the key drivers of litterfall inputs through stand characteristics and climatic factors (Berg and Laskowski, 2006; Erkan et al., 2017; Li et al., 2019). However, annual litterfall inputs vary considerably depending on stand characteristics, such as basal area, stem volume, and aboveground biomass (Kim et al., 2012; Erkan et al., 2017), whereas there was a large variability between litterfall production and mean values of climatic factors. The use of stand characteristics may result in more realistic litterfall estimates because the amount of litterfall inputs depends on several ecological properties and forest management activities, such as tree species, site quality, stand age, stand density, fertilization, and thinning (Kim et al., 2012; Bueis et al., 2018; Çömez et al., 2019). In addition, it is difficult to use climate data for the actual site and annual litterfall values at regional scales (Starr et al., 2005).

Although many linear and multiple regression models have been developed to estimate litterfall inputs from environmental and structural variables of forest stands, such as stand age, basal area, canopy cover, site index, growing stock, climate factor, and altitude (Berg and Laskowski, 2006; Erkan et al., 2017; Neumann et al. 2018; Li et al., 2019), developing models to characterize litterfall inputs are challenging owing to high variability in space and time in the input patterns of litterfall. Allometric relationships between litterfall components and aboveground biomass may provide a new conceptual understanding of litterfall inputs (Erkan et al., 2017; Fu et al., 2017) because allometric relationships exist among different tree organs. In addition, tree biomass functions are widely available from field observations or forest inventory data of Korea (Korea Forest Research Institute, 2010; Kim et al., 2017).

Although many studies have examined the drivers of litterfall inputs based on a stand scale (Mun et al., 2007; Kim, 2016), few studies have analyzed litterfall inputs across regional scales in Korea. The objectives of this study were to develop allometric models to predict litterfall inputs in Korean red pine (Pinus densiflora S. et Z.), which is a representative coniferous species distributed widely in Korea. In this study, we examined that annual litterfall inputs of Korean red pine stands may be predicted using stand parameters.

Materials and Methods

The litterfall used in this study was compiled from data with varying sampling for 2-4 years (Table 1) collected from 45 plots on seven regional scales (Goseong-gun, Hadong-gun, Hamyang-gun, Jinju-si, Sacheon-si, Sancheong-gun, and Uiryeong-gun) in Gyeongsangnam-do. The mean annual precipitation and temperature for 30 years in the study areas were 1,320 mm year−1 and 12.8°C for Hamyang-gun, 1,556 mm year−1 and 12.8°C for Sancheong-gun, 1,493 mm year−1 and 13.5°C for Jinju-si, and 1,436 mm year−1 and 13.6°C for Uiryeong-gun, respectively (Korea Meteorological Administration, 2011). The soils in the study site are well-drained, slightly wet, or dry brown forest soil (mostly Inceptisols USDA soil taxonomy) originating from granite or granite gneiss for Hamyang-gun, Hadong-gun, Sancheong-gun, and Uiryeong-gun, with a loamy texture, whereas the soils in Goseong-gun and Jinju-si are slightly dry dark reddish brown forest soil (mostly Inceptisols USDA soil taxonomy) originating from sandstone or shale. The study sites were pure or almost pure Korean red pine stands with a few other tree species, mainly Quercus spp. Stand age ranged from 25 to 80 years, with various mean diameter at breast height (DBH) and basal areas (Table 1). To measure litterfall inputs, three or five circular litter traps with a surface area of 0.25 m2 were installed 60 cm above the forest floor at various sizes of sample plots (10×10 m, 10×20 m, and 20× 20 m). Litter traps were of the same type in all sampling years and plots. The sampling frequency varied at one- or three-month intervals throughout the year. The litter from each trap was transported to a laboratory and then ovendried at 65°C for 48 h. All dried samples were separated into needle, broadleaved, branches, bark, and miscellaneous litter with reproduction components (flower and cone), and each portion was weighed.

Table 1. General stand characteristics of the study sites.
Region Stand age Location Elevation (m a.s.l.) Stand density (tree ha−1) DBH (cm) Basal area (m ha−1) Sampling year (No. of plot)
Sancheong-gun 40-50 35°29′04″N
127°58′10″E
730 1,766/600-3,150* 21.2/15.8-26.2* 53.0/32.1-70.5* 2006-2007 (6)
Hamyang-gun 45 35°27′53″N
128°38′58″E
684 216/200-250 34.0/31.3-36.8 20.5/19.7-21.3 2007-2008 (3)
Sancheong-gun 40-50 35°29′35″N
128°57′40″E
750 1,020/500-1,525 21.1/18.8-24.9 34.2/21.4-46.7 2007-2008 (6)
Jinju-si 40-50 35°12′21″N
128°10′24″E
150 1,311/300-2,500 14.3/6.0-23.0 22.3/4.2-25.9 2010-2011 (9)
Jinju-si 40-50 35°12′30″N
128°10′27″E
196 1,172/600-1,700 15.9/12.6-22.7 23.9/15.8-37.9 2011-2015 (18)
Sancheong-gun 55-62 35°22′26″N
127°51′13″E
484 625 34.9 59.7 2011-2012 (1)
Sancheong-gun 25-35 35°24′10″N
127°48′46″E
350 2,225 14.7 66.3 2011-2012 (1)
Jinju-si 52-54 35°12′45″N
128°10′06″E
190 1,075 25.9 55.0 2011-2012 (1)
Jinju-si 33-35 35°12′30″N
128°10′27″E
196 400 31.6 31.4 2011-2012 (1)
Goseong-gun 50-80 35°04′43″N
128°15′47″E
246 575 37.1 24.9 2011-2012 (1)
Hadong-gun 50-70 35°12′26″N
127°43′12″E
524 675 28.3 22.4 2011-2012 (1)
Hadong-gun 40-50 35°12′25″N
127°43′11″E
519 2,225 27.5 29.9 2011-2012 (1)
Hadong-gun 35-35 35°12′32″N
127°42′52″E
497 1,775 20.6 29.6 2011-2012 (1)
Uiryeong-gun 35-45 35°22′14″N
128°10′37″ E
401 550 24.9 22.3 2011-2012 (1)
Uiryeong-gun 35-45 35°22′13″N
128°10′35″E
430 1,480/960-1,920 24.3/22.9-26.6 46.6/35.9-55.8 2014-2015 (4)
Jinju-si 40-50 35°12′31″N
128°10′27″E
160 2,540/1,440-3,240 15.0/12.4-18.1 28.7/20.2-44.0 2014-2015 (4)
Sacheon-si 40-50 35°04′19″N
128°02′00″E
30 1,075/900-1,400 16.4/15.5-17.5 25.9/18.6-36.8 2018-2019 (4)

mean/minimum-maximum.

Download Excel Table

A total of 102 observations of annual litterfall from 45 plots were used to develop allometric models to predict litterfall component inputs for Korean red pine stands, based on the stand parameters. The stand parameters included: 1) basal area, 2) stand density, 3) mean DBH, and 4) carbon stocks of aboveground tree biomass, such as needles, branches, stems, and total tree biomass. Carbon stocks of aboveground tree biomass in each stand were estimated using allometric equations based on DBH (1.2 m) for individual trees of Korean red pine in Gyeongsangnam-do, as reported by Kim et al. (2017). Litterfall data were log-transformed to achieve normality because of a broad variation in stand structure and environmental factors.

The allometric regression model to predict the annual litterfall input was as follows:

log 10 y = a + b log 10 x

where y is the annual litterfall input (kg ha−1year−1), x is the stand parameter, a is a constant, and b is a coefficient.

The accuracy of the allometric equations was evaluated using the coefficient of determination (R2) and root mean square error (RMSE) (Socha and Wezyk, 2007). Bias correction factors (CF) in the logarithmic transformation were calculated using the standard error of the estimate (Garcia Villacorta et al., 2015). Pearson correlation analysis using non-log-transformed data was performed between litterfall input and stand parameters (SAS Institute Inc., 2003).

Results

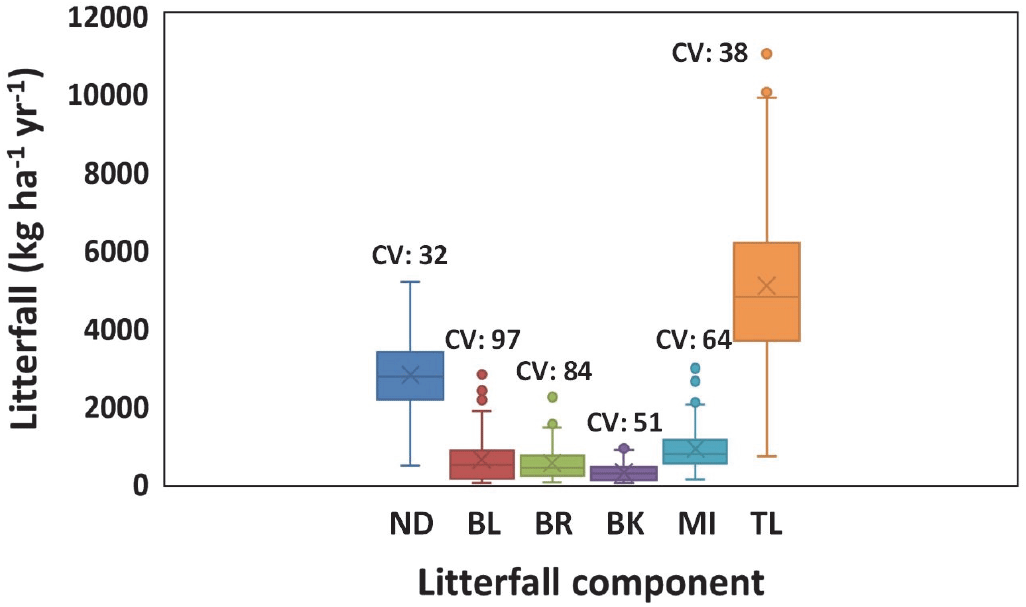
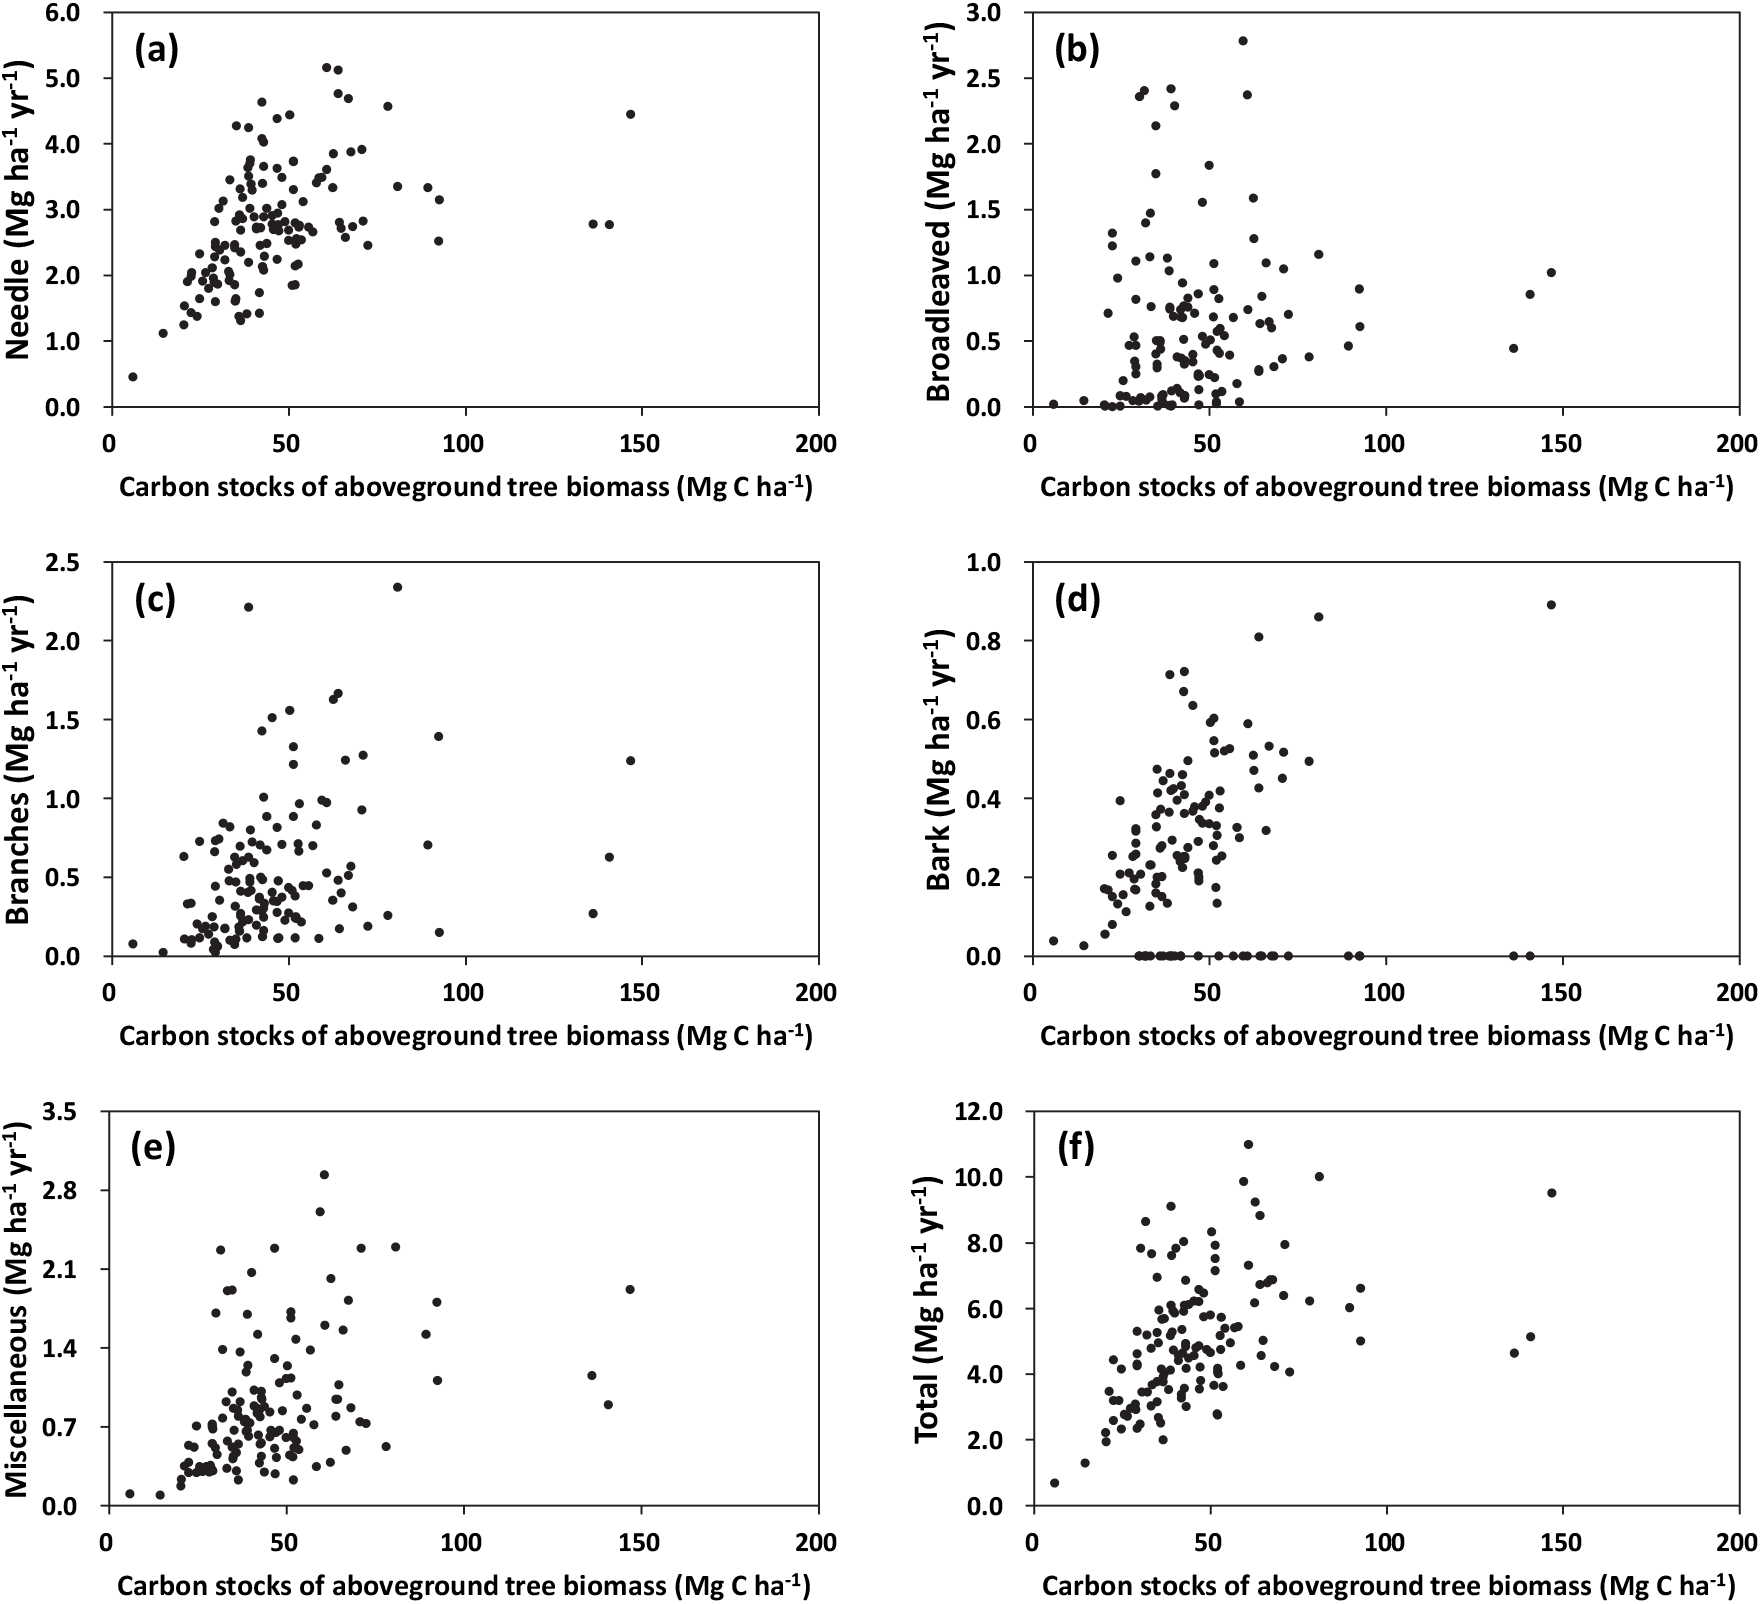
The annual inputs of needles, broadleaved, branches, bark, miscellaneous, and total litter are shown in Figure 1. The mean annual litterfall was highest at 2,779 kg ha−1 year−1 for needle litter, followed by 883 kg ha−1 year−1 for miscellaneous litter, 611 kg ha−1 year−1 for broadleaved litter, 513 kg ha−1 year−1 for branch litter, and 340 kg ha−1 year−1 for bark litter. The mean annual total litterfall ranged from 696 kg ha−1 year−1 to 11,014 kg ha−1 year−1, with a mean value of 5,051 kg ha−1 year−1. The coefficient of variation was lowest in needle litter (32%), followed by total litterfall (38%), bark litter (51%), miscellaneous litter (64%), branch litter (84%), and broadleaved litter (97%). The coefficient of variation calculated across the regional scales showed the highest coefficient variation in broadleaved litterfall because there were no regular input patterns compared with other litterfall components (Figure 2).
jksfs-110-4-569-g1
Figure 1. Box plot of litterfall components in Pinus densiflora stands. CV: coefficient of variation. The box represents the median and the 25th and 75th percentiles, × represents the arithmetic mean, the solid lines extend to 1.5 of the interquartile range and the values outside this range are indicated by circle. ND: needle litter, BL: broadleaved litter, BR: branches, BK: bark, MI:miscellaneous, TL: total litterfall.
Download Original Figure
jksfs-110-4-569-g2
Figure 2. Scatter plots between litterfall inputs and carbon stocks of aboveground tree biomass in Pinus densiflora stands (a: needle litter, b: broadleaved litter, c: branches, d: bark, e: miscellaneous, f: total litterfall).
Download Original Figure

Litterfall components were significantly correlated (P < 0.05) with stand parameters, except for broadleaved litter (Table 2). The carbon stock of aboveground tree biomass showed a stronger correlation with all litterfall components than the other stand variables, such as basal area, stand density, and mean DBH (Table 2). The allometric equations for all the litterfall components were significant (P < 0.05) with stand parameters accounting for 5-43% of the needle litter and 8-42% of the variation in total litter, except for stand density (Table 3). Based on the R2, generally the best fits for litterfall components were obtained for carbon stock of aboveground tree biomass.

Table 2. Pearson correlation coefficients of the stand characteristics and litterfall components.
Variable Needle Broadleaved Branches Bark Miscellaneous Total litter
Basal area 0.34*** 0.01ns 0.31*** 0.42*** 0.35*** 0.34***
Stand density 0.28** −0.13ns 0.01ns 0.16ns 0.04ns 0.09ns
Mean DBH 0.21* 0.091ns 0.13ns 0.28*** 0.17* 0.17*
Carbon stocks of needle biomass 0.53*** 0.06ns 0.36*** 0.59*** 0.39*** 0.40***
Carbon stocks of branch biomass 0.50*** 0.13ns 0.38*** 0.66*** 0.43*** 0.43***
Carbon stocks of stem biomass 0.43*** 0.12ns 0.31*** 0.66*** 0.38*** 0.38***
Carbon stocks of aboveground tree biomass 0.44*** 0.12ns 0.33*** 0.66*** 0.39*** 0.39***

ns: non-significant, * P<0.05, ** P<0.01, *** P<0.001.

Download Excel Table
Table 3. Regression parameters for allometric equations in litterfall inputs of Pinus densiflora stands

Allometric equation form is log10y = a + b log10x. y: litterfall components, x: variable of stand characteristics. The R2 is the coefficient of determination. P-values represent the significance of the equations. Root means squared error (RMSE); Correction factor (CF).

Variable (x) Litter component (y) a b R 2 RMSE P-value CF
Basal area (m2 ha−1) Needle 2.7702 0.4503 0.28 0.1314 0.0001 1.020
Broadleaved 1.3097 0.8158 0.05 0.6453 0.0093 1.615
Branches 1.3974 0.8061 0.14 0.3607 0.0001 1.162
Bark 1.3199 0.8070 0.33 0.2140 0.0001 1.054
Miscellaneous 1.7992 0.7366 0.23 0.2476 0.0001 1.073
Total 2.9583 0.4931 0.24 0.1590 0.0001 1.030
Stand density (tree ha−1) Needle 2.8223 0.1943 0.08 0.1489 0.0011 1.026
Broadleaved 1.5017 0.3203 0.01 0.6858 0.2162 1.648
Branches 2.3323 0.6739 0.01 0.3894 0.6284 1.191
Bark 1.6284 0.2759 0.06 0.2544 0.0156 1.077
Miscellaneous 2.4608 0.1303 0.01 0.2805 0.2375 1.095
Total 3.2803 0.1266 0.02 0.1807 0.0759 1.038
Mean DBH (cm) Needle 2.9708 0.3601 0.05 0.1510 0.0079 1.027
Broadleaved 1.3216 0.9348 0.02 0.6559 0.1095 1.641
Branches 1.6819 0.7047 0.03 0.3834 0.0397 1.185
Bark 1.5229 0.7590 0.09 0.2502 0.0024 1.075
Miscellaneous 1.9847 0.7038 0.06 0.2733 0.0042 1.095
Total 3.0332 0.5106 0.08 0.1757 0.0013 1.036
Carbon stocks of needle biomass (kg C ha−1) Needle 1.3058 0.6427 0.40 0.1203 0.0001 1.017
Broadleaved −1.8426 1.3162 0.09 0.6313 0.0004 1.582
Branches −0.9507 1.0674 0.17 0.3542 0.0001 1.155
Bark −0.3200 1.1583 0.46 0.1932 <0.0001 1.044
Miscellaneous −0.2120 0.9345 0.25 0.2435 <0.0001 1.071
Total 1.3266 0.7123 0.35 0.1472 <0.0001 1.025
Carbon stocks of branch biomass (kg C ha−1) Needle 1.2401 0.5786 0.43 0.1172 <0.0001 1.016
Broadleaved −2.3203 1.2760 0.11 0.6232 0.0002 1.564
Branches −1.2299 1.0061 0.21 0.3473 <0.0001 1.149
Bark −1.6504 1.0995 0.53 0.1797 <0.0001 1.038
Miscellaneous −0.5433 0.9039 0.32 0.2330 <0.0001 1.065
Total 1.1319 0.6736 0.42 0.1393 <0.0001 1.023
Carbon stocks of stem biomass (kg C ha−1) Needle 1.0416 0.5237 0.40 0.1207 <0.0001 1.017
Broadleaved −2.9347 1.1939 0.11 0.6329 0.0001 1.395
Branches −1.5725 0.9102 0.19 0.3510 <0.0001 1.152
Bark −2.4434 1.0876 0.53 0.1795 <0.0001 1.038
Miscellaneous −0.8835 0.8248 0.30 0.2365 <0.0001 1.067
Total 0.8986 0.6103 0.39 0.1433 <0.0001 1.024
Carbon stocks of aboveground tree biomass (kg C ha−1) Needle 0.9321 0.5374 0.40 0.1200 <0.0001 1.017
Broadleaved −3.1314 1.2137 0.11 0.6241 <0.0001 1.558
Branches −1.7561 0.9325 0.19 0.3505 <0.0001 1.152
Bark −2.5916 1.0988 0.53 0.1795 <0.0001 1.038
Miscellaneous −1.0415 0.8432 0.30 0.2361 <0.0001 1.066
Total 0.7774 0.6248 0.40 0.1428 <0.0001 1.024
Download Excel Table

Discussion

The mean inputs of total litterfall (5,051 kg ha−1 year−1) in this study fall within the published range (4,0385,589 kg ha−1 year−1) of values recorded for Korean red pine forests (Jeong et al., 2009; Kim et al., 2012). It is also similar to the average litterfall (5,500 kg ha−1 year−1) in other temperate coniferous forests (Bray and Gorham, 1964). The coefficient of variation in needle or total litter inputs in the present study was slightly lower than in other studies, which was 36% for needle litterfall and 45% for total litterfall in Pinus brutia in Turkey, as observed by Erkan et al. (2017).

Inputs of litterfall components were significantly correlated with most of the variables included in the study, whereas non-significant correlations were found in broadleaved litterfall. Similar results were reported by other studies, in which leaf fall of most non-dominant tree species varied to a greater extent with the size of the gap and the intensity of forest management practices (Kim, 2016; Lado-Monserrat et al., 2016; Bueis et al., 2018). For example, Kim (2016) reported that the inputs of broadleaved litter in P. densiflora stands were not correlated (P > 0.05) with thinning intensity. In contrast to broadleaved litterfall, other litterfall components were well correlated with stand characteristics involved in canopy closure, except for needle and branch litterfall of stand density, and branch litterfall of mean DBH. The annual needle or total litterfall in many studies has been found to correlate with factors involving stand characteristics, such as basal area, stand volume, and stand biomass on a stand scale (Kim, 2016; Bueis et al., 2018; Kim et al., 2019). However, the stand density of Korean red pine stands on a regional scale was not an important variable for predicting litterfall inputs because this variable could be related to forest management activities, such as thinning practices. In contrast, carbon stocks of aboveground tree biomass showed a stronger correlation with litterfall compared to the other stand variables. Other studies found similar results, where litterfall inputs were closely related to growth variables, such as basal area and stand volume (Kim, 2016; Erkan et al., 2017).

In allometric models for the total and needle litterfall, basal area and carbon stocks of aboveground tree biomass appeared to be effective predictors of spatial variation in litterfall inputs on a regional scale. Similar results were observed by Kim (2016), who found that following forest tending works, Korean red pine stands showed a strong linear correlation between needle litterfall and stand basal area (r2= 0.72) on a stand scale. Erkanet al. (2017) presented regression models (r2= 0.78) explaining litterfall production by aboveground biomass related to canopy closure of Pinus brutia forests in Turkey. However, stand density and mean DBH, which were not related to canopy closure, were not important predictive variables in litterfall input models of Korean red pine stands.

Conclusions

Allometric regression models based on stand characteristics were developed for predicting annual litterfall input in mature Korean red pine stands on a regional scale. Carbon stocks of aboveground tree biomass were the most important variables explaining litterfall inputs on a spatial scale, whereas stand density and mean DBH were less reliable in terms of model accuracy. The results suggest that models developed from the basal area or carbon stocks of aboveground tree biomass may be used effectively for quantifying litterfall inputs in Korea red pine stands.

Acknowledgement

This work was partially supported by the National Research Foundation of Korea (NRF) grant funded by the Korea government (MSIT) (2020R1A2C1005791).

References

1.

Berg, B. and Laskowski, R. 2006. Litter decomposition: A guide to carbon and nutrient turnover. Advance in Ecological Research 38: 20-71.

2.

Bray, J.R. and Gorham, E. 1964. Litter production in forests of the world. Advance in Ecological Research 2: 101-157.

3.

Bueis, T., Bravo, F., Pando, V. and Turrión, M.B. 2018. Local basal area affects needle litterfall, nutrient concentration, and nutrient release during decomposition in Pinus halepensis Mill. Plantations in Spain. Annals of Forest Science 75(1): 21.

4.

Çömez, A., Tolunay, D. and Güner. 2019. Litterfall and the effects of thinning and seed cutting on carbon input into the soil in Scots pine stands in Turkey. European Journal of Forest Research 138(1): 1-14.

5.

Erkan, N., Comez, A., Aydin, A.C., Denli, O. and Erkan, S. 2017. Litterfall in relation to stand parameters and climatic factors in Pinus brutia forests in Turkey. Scandinavian Journal of Forest Research 33(4): 338-346.

6.

Fu, C., Yang, W., Tan, B., Xu, Z., Zhang, Y., Yang, J., Ni, X. and Wu, F. 2017. Seasonal dynamics of litterfall in a sub-alpine spruce-fir forest on the eastern Tibetan Plateau: allometric scaling relationships based on one year of observations. Forests 8(9): 314.

7.

Garcia Villacorta, A.M., Martin, T.A., Jokela, E.J., Cropper Jr, W.P. and Gezan, S.A. 2015. Variation in biomass distribution and nutrient content in loblolly pine (Pinus taeda L.) clones having contrasting crown architecture and growth efficiency. Forest Ecology and Management 342: 84-92.

8.

Jeong, J., Kim, C., An, H.C., Cho, H.S. and Choo, G.C. 2009. A comparison of litterfall dynamics in three coniferous plantations of identical age under similar site conditions. Journal of Ecology and Field Biology 32(2): 97-102.

9.

Kim, C., Son, Y., Lee, Y.K., Jeong, J., Noh, N.J., Kim, S.R., Yang A.R. and Ju, N.G. 2012. Influence of forest tending (Soopkakkugi) works on litterfall and nutrient inputs in a Pinus densiflora stand. Forest Science and Technology 8(2): 83-88.
,

10.

Kim, C. 2016. Basal area effects on a short-term nutrient status of litter fall and needle litter decomposition in a Pinus densiflora stand. Journal of Ecology and Environment 39(1): 51-60.

11.

Kim, C., Yoo, B.O., Jung, S.Y. and Lee, K.S. 2017. Allometric equations to assess biomass, carbon and nitrogen content of black pine and red pine trees in southern Korea. iForest-Biogeoscience and Forestry 10: 483-490.

12.

Kim, C., Kim, S., Baek, G. and Yang, A.R. 2019. Carbon and nitrogen responses in litterfall and litter decomposition in red pine (Pinus densiflora S. et Z.) stands disturbed by pine wilt disease. Forests 10(3): 244.

13.

Korea Forest Research Institute. 2010. Carbon Emission Coefficients of Forest Tree Species for Inventory of Greenhouse Gas. Research Report 10-25. Ukgo Publisher. pp. 89

14.

Korea Meteorological Administration 2011. Climatological Normal of Korea. Korea Meteorological Administration, Seoul, pp. 678.

15.

Lado-Monserrat, L., Lidón, A. and Bautista, I. 2016. Erratum to: Litterfall, litter decomposition and associated nutrient fluxes in Pinus halepensis: Influence of tree removal intensity in a Mediterranean forest. European Journal of Forest Research 135(1): 203-214.

16.

Lehtonen, A., Sievänen, R., Mäkelä, A., Mäkipää, R., Korhonen, K.T. and Hokkanen, T. 2004. Potential litterfall of Scots pine branches in southern Finland. Ecological Modelling 180(2-3): 305-315.

17.

Li, S., Yuan, W., Ciais, P., Viovy, N., Ito, A., Jia, B. and Zhu, D. 2019. Benchmark estimates for a aboveground litterfall data derived from ecosystem models. Environmental Research Letters 14(8): 084020.

18.

Mun, H.T., Kim, S.J. and Shin, C.H. 2007. Litter production and nutrient contents of litterfall in oak and pine forests at Mt. Worak national park. Journal of Ecology and Field Biology 30(1): 63-68.

19.

Neumann, M., Ukonmaanaho, L., Johnson, J., Benham, S., Vesterdal, L., Novotný, R., Verstraeten, A., Lundin, L., Thimonier, A., Michopoulos, P. and Hasenauer, H. 2018. Quantifying carbon and nutrient input from litterfall in European forests using field observations and modeling. Global Biogeochemical Cycles 32(5): 784-798.

20.

Starr, M., Saarsalmi, A., Hokkanen, T., Merilä, P. and Helmisaari, H.S. 2005. Models of litterfall production for Scots pine (Pinus sylvestris L.) in Finland using stand, site and climate factors. Forest Ecology and Management 205(1-3): 215-225.

21.

Socha, J. and Wezyk, P. 2007. Allometric equations for estimating the foliage biomass of Scots pine. European Journal of Forest Research 126(2): 263-270.

22.

SAS Institute Inc. 2003. SAS/STAT Statistical Software. Version 9.1. SAS publishing Cary, NC.