Article
상대밀도에 따른 우리나라 주요 경제수종의 적정 임분밀도관리 분석
Analysis of Adequate Stand Density Management for Major Commercial Species in Korea using Relative Density
Heejun Jin
1
, Daesung Lee
2
, Sanghyun Jung
1
, Jungkee Choi
1,*
1Department of Forest Management, Kangwon National University, Chuncheon 24341, Korea
2Natural Resources Institute Finland (Luke), Latokartanonkaari 9, 00790 Helsinki, Finland
© Copyright 2024 Korean Society of Forest Science. This is an Open-Access article distributed under the terms of the
Creative Commons Attribution Non-Commercial License (http://creativecommons.org/licenses/by-nc/4.0/) which permits
unrestricted non-commercial use, distribution, and reproduction in any
medium, provided the original work is properly cited.
Received: May 02, 2024; Revised: Aug 16, 2024; Accepted: Sep 20, 2024
Published Online: Sep 30, 2024
요 약
본 연구는 우리나라의 주요 침엽수종인 소나무, 잣나무, 낙엽송 경제림을 대상으로 적정 임분밀도관리기준을 파악하기 위하여 수행되었다. 이를 위해 상대밀도(Relative density, RD)를 활용하여 임분의 고사목 발생량, 평균 흉고직경 생장량, 형상비를 분석하였다. 상대밀도 0.7 이상에서 세 수종의 평균 고사목 본수는 15-24 trees/ha, 고사목 비율은 20.0%-35.4% 증가하는 것으로 나타났다. 상대밀도가 증가함에 따라 평균 흉고직경 생장량은 수종별로 0.2-0.5 cm/year가 감소하고, 형상비는 46.9%-71.4% 증가하였다. 본 연구결과에 따라 소나무와 낙엽송은 RD 0.7, 잣나무는 RD 0.8을 적정 임분밀도관리기준으로 선정한다면 고사목을 줄이고 생장량을 증가시켜 양질의 목재생산을 할 수 있을 것으로 판단된다.
Abstract
This study was performed to analyze adequate stand density management criteria for commercial forests of the major coniferous species, Pinus densiflora, P. koraiensis, and Larix kaempferi in South Korea. Relative density (RD) was applied to analyze occurrence of mortality, mean DBH growth, and height-diameter (HD) ratio. The results showed that when RD was 0.7 or higher, the average number of mortality in all three species increased to 15-24 trees/ha, with mortality rates ranging from 20.0%-35.4%. As RD increased, mean DBH growth decreased 0.2-0.5 cm/year by species, but the HD ratio increased 46.9%-71.4%. Consequently, if adequate stand density management criteria are selected with RD 0.7 for P. densiflora and L. kaempferi and RD 0.8 for P. koraiensis, it is considered to increase high-quality timber production with lower mortality and increased growth.
Keywords: plantation; stand density; mortality; DBH growth; height-diameter ratio; thinning
서 론
우리나라는 목재 자급률 증대를 통한 경제임업을 추진하고 있어 지속가능한 목재생산에 대한 관심이 더욱 커지고 있다(Korea Forest Service, 2022). 이를 위해 목재생산림의 역할은 더욱 중요해지고 있으며, 주요 경제수종의 합리적인 목표 생산재별 시업체계가 요구되고 있다. 따라서 주요 경제수종의 효율적인 관리·육성은 장기 모니터링 연구를 기반으로 현실림에 적용가능한 시업기준을 필요로 하며, 이를 통해 간벌과 같은 숲가꾸기 시업을 적기에 추진해야 한다(Kang et al., 2016; Shin et al., 2022). 솎아베기로도 불리는 간벌은 임분밀도를 낮추고, 입목 간 경쟁을 완화하는 인공림 경영의 대표적인 숲가꾸기 시업방법이다(Choi et al., 2014a). 이를 통해 잔존목의 직경 생장 촉진, 입목형질 및 형상비 개선, 자연고사 방지 등의 효과를 얻을 수 있다(Rantala, 2011; Korea Forest Research Institute, 2015). 따라서 산림의 목재생산 역할을 극대화하기 위해서는 간벌을 통한 밀도관리가 반드시 필요하다(Smith, 1986; Nyland, 1996; Son et al., 2017).
임분밀도관리 연구는 최대임분밀도에 기반한 적정 임분밀도관리기준을 통해 입목 간의 경쟁을 억제하여 임분을 관리하고, 생장수확 모델 및 시뮬레이션 개발에 활용되기 때문에 필수적이다(Hynynen, 1993; Zeide, 2005; Pretzsch and Biber, 2005; Burkhart, 2013). 임업선진국에서는 다양한 밀도를 가진 임분을 장기적으로 반복 모니터링하여 임분밀도관리 연구를 활발히 진행하고 있다. 이를 위해 임분밀도를 정확하게 평가하고자 수종별 평균 흉고직경이 특정 값일 때 입목이 생장할 수 있는 최대의 본수를 분석한 최대임분밀도지수(Maximum stand density index, SDImax)를 계산하였으며, 임분이 SDImax의 기준과 동일한 평균 흉고직경일 때 가지는 본수를 추정하여 임분밀도를 나타내는 임분밀도지수(Stand density index, SDI)를 산출하였다(Reineke, 1933; Sterba, 1987; Williams, 1996; Zeide, 2002; Williams, 2003; VanderSchaaf and Burkhart, 2007; Vospernik and Sterba, 2015; Yang and Burkhart, 2017).
국내 임분밀도관리 연구는 임분밀도지수를 활용하여 적정밀도 분석을 수행하기도 하였으며(Lee et al., 2000; Kim et al., 2017), 상대수확량지수나 형상비를 활용하여 소나무림, 낙엽송림, 편백나무림을 대상으로 분석하였다(Park et al., 2017; Park et al., 2020; Jung et al., 2024). 선행연구들에서 주로 사용한 국가산림자원조사 자료는 생장수확 연구를 주 목적으로 조사된 것이 아니기 때문에 목재생산림의 임분밀도를 평가하는데 일부 제약이 존재한다. 최근에는 이를 보완하기 위해 인공림의 반복측정된 자료를 사용하여 입목본수, 평방평균흉고직경, 임분 흉고단면적의 관계를 이용한 소나무, 잣나무, 낙엽송 인공림의 임분밀도지수, 최대임분밀도지수, 상대입목축적차트가 개발되었다(Lee and Choi, 2019; Lee and Choi, 2020). 그러나 아직까지 인공림의 생장 변화를 고려한 적정 임분밀도관리기준을 제시하는 연구는 부족한 실정이다.
따라서 본 연구는 국내 주요 침엽수종인 소나무(Pinus densiflora), 잣나무(P. koraiensis), 낙엽송(Larix kaempferi) 인공림을 대상으로 반복측정한 실증자료를 통해 최대임분밀도지수와 임분밀도지수의 비인 상대밀도(Relative density, RD)를 산출하고, 임분밀도에 따른 고사목 발생, 흉고직경 생장량, 형상비를 분석하여 목재생산림의 합리적인 숲가꾸기 시업을 위한 적정 임분밀도관리기준을 제시하고자 하였다.
재료 및 방법
1. 연구대상지 및 연구자료
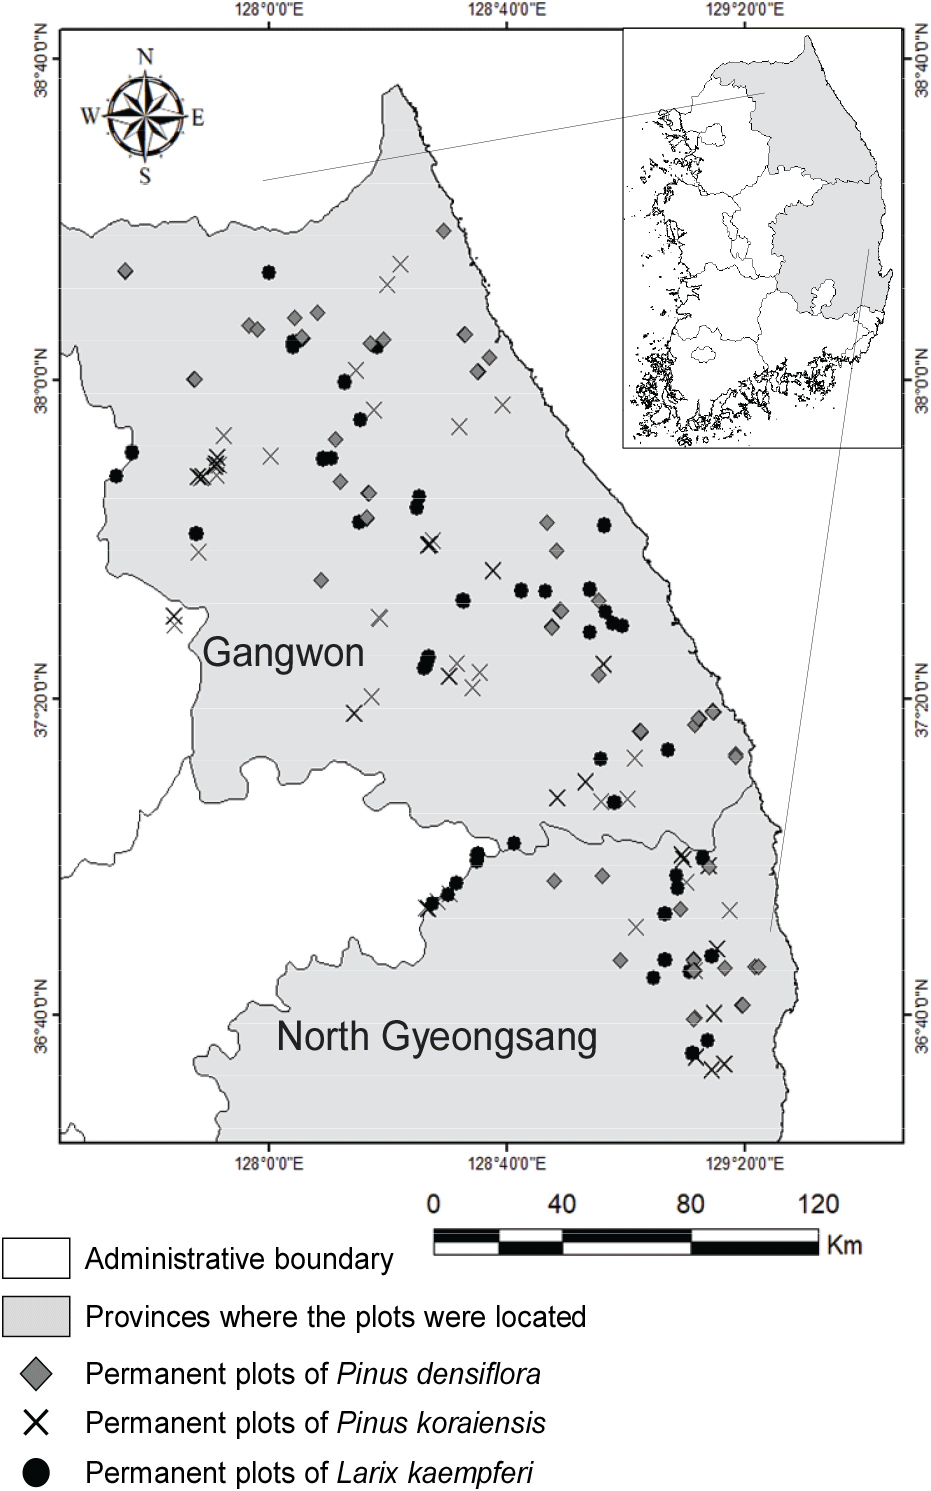
본 연구대상지는 북부·동부·남부지방산림청 관할 국유림 내 분포하는 인공림이며, 강원 및 경상북도 지역 내 소나무 46개소, 잣나무 51개소, 낙엽송 45개소 영구고정표준지에서 자료가 수집되었다(Figure 1). 표준지는 2012-2014년에 설치 및 1차 조사를 실시하였고, 이후 3년 간격으로 반복 조사하여 2021-2023년에 4차 조사를 실시하였다. 각 임분 내 표준지는 무간벌구(20 m × 20 m), 약도간벌구(25 m × 25 m), 강도간벌구(30 m × 30 m)로 구성되어 총 3개의 간벌구가 있으며, 간벌률은 0%-59.8%로 나타났다(Lee and Choi, 2019).
Figure 1.
Map of the study area for permanent plots of Pinus densiflora, Pinus koraiensis and Larix kaempferi.
Download Original Figure
본 연구에는 반복측정을 포함하여 총 소나무 380개, 잣나무 414개, 낙엽송 484개의 임분단위 조사자료가 사용되었다. 매 조사시기마다 간벌구 내 6 cm 이상인 모든 입목들을 대상으로 개체목의 흉고직경, 총수고, 지하고, 수관폭, 수간형질, 고사여부 등을 측정하였다(Choi et al., 2014b). 임령은 소나무의 경우 8-108년생, 잣나무 15-86년생, 낙엽송 19-69년생으로 다양하게 분포하였으며, 평균 임령은 각각 48년생, 44년생, 42년생으로 나타났다. 평균 흉고직경의 경우 임령에 따라 소나무가 4.2-43.6 cm, 잣나무 9.5-48.0 cm, 낙엽송 10.4-46.4 cm로 분포하였으며, 평균은 각각 24.8 cm, 27.6 cm, 25.2 cm로 분석되었다. 평방평균흉고직경의 경우 평균 흉고직경과 유사하였으며, 평균 수고는 낙엽송이 22.2 m로 소나무 14.4 m, 잣나무 17.1 m보다 높게 나타났다. 입목본수는 소나무 156-2928 trees/ha, 잣나무 185-2155 trees/ha, 낙엽송 170-1666 trees/ha으로 다양한 임분밀도를 가지고 있으며, 평균은 740 trees/ha, 660 trees/ha, 625 trees/ha이었다. 수종별 지위지수는 소나무 10.3-31.0 m, 잣나무 15.3-24.6 m, 낙엽송 15.8-31.1 m의 범위에 분포하였다(Table 1).
Table 1.
Stand characteristics of the experimental plots by species in this study.
|
Species |
Statistics |
Stand age (year) |
Mean DBH (cm) |
Quadratic mean diameter (cm) |
Mean height (m) |
No. of trees (trees/ha) |
Site indexb) (m) |
|
Pinus densiflora (na)=380) |
Mean |
48 |
24.8 |
25.6 |
14.4 |
740 |
17.9 |
|
Std. Dev. |
19 |
7.9 |
8.1 |
4.1 |
480 |
3.1 |
|
Minimum |
8 |
4.2 |
3.4 |
2.9 |
156 |
10.3 |
|
Maximum |
108 |
43.6 |
45.2 |
22.2 |
2928 |
31.0 |
|
Pinus koraiensis (n=414) |
Mean |
44 |
27.6 |
28.2 |
17.1 |
660 |
19.3 |
|
Std. Dev. |
16 |
8.2 |
8.3 |
4.3 |
381 |
1.7 |
|
Minimum |
15 |
9.5 |
9.8 |
5.3 |
185 |
15.3 |
|
Maximum |
86 |
48.0 |
48.2 |
26.8 |
2155 |
24.6 |
|
Larix kaempferi (n=484) |
Mean |
42 |
25.2 |
25.9 |
22.2 |
625 |
25.2 |
|
Std. Dev. |
13 |
6.4 |
6.5 |
4.6 |
298 |
2.8 |
|
Minimum |
19 |
10.4 |
10.6 |
7.6 |
170 |
15.8 |
|
Maximum |
69 |
46.4 |
46.5 |
32.2 |
1666 |
31.1 |
Download Excel Table
2. 분석방법
임분밀도를 관리하는 목적은 고사목 발생을 감소시키고, 임분의 직경 생장을 촉진시켜 낭비없는 최대의 목재수확을 하는 동시에 임분의 건정성을 확보하는 것이다. 따라서 적정 임분밀도관리기준을 제시하기 위해 수집한 실증자료를 통해 임분밀도에 따른 생장인자들의 변화를 분석하였다. 임분밀도와 입목크기 관계에서 대표적으로 이용되는 평방평균흉고직경()은 식 1과 같이 개체목 평균 흉고단면적에 해당되는 평균 흉고직경으로 계산하였고, 측정이 상대적으로 용이한 흉고직경과 입목본수만으로 임분밀도를 계산할 수 있는 임분밀도지수(SDI)와 최대임분밀도지수(SDImax)는 우리나라의 소나무, 잣나무, 낙엽송을 대상으로 경쟁밀도 법칙(Competition-density rule)을 활용한 Lee and Choi(2019)의 파라미터를 이용하였다(식 2, 3). 수종별로 최대임분밀도지수가 다르기 때문에 임분밀도의 비교를 용이하게 하고자, 식 4와 같이 상대밀도(Relative density, RD)를 이용하였다. 고사목은 고사목 발생량과 식 5를 통해 고사목이 발생한 임분의 비율을 계산하였다.
임분밀도 관리의 중요한 목적 중 하나인 평균 흉고직경 생장량()은 3년 간격의 반복측정한 자료를 바탕으로 식 6과 같이 연년생장량을 계산하여 검증하였다. 밀도에 따른 임분의 건정성을 평가하기 위한 인자로 형상비(HD ratio)는 흉고직경과 수고의 비율을 이용하여 식 7과 같이 분석하였다(Kang et al., 2019).
: Quadratic mean diameter (cm), : Mean tree basal area in a stand (m2), SDI: Stand density index (trees/ha at 25 cm of ), SDImax: Maximum stand density index (trees/ha at 25 cm of ) for Pinus densiflora, P. koraiensis and Larix kaempferi is 1041 trees/ha, 1089 trees/ha, 1005 trees/ha (Lee and Choi, 2019), TPH: Trees per hectare (trees/ha), : Parameter for P. densiflora, P. koraiensis and L. kaempferi, a0 is 1.600 × 10⁻⁵, 6.443 × 10⁻⁶, 4.113 × 10⁻⁶ and a1 is 0.0601, 0.3404 and 0.4498 and b0 is 1.0106, 2.6654 and 1.3765 and b1 is −1.2904, −1.5900 and −1.2068, RD: Relative density, PPM(%): Proportion of plots with mortality, plotn: the total number of plots, plotm: the number of plots with mortality, : Periodic annual increment of mean dbh (cm/year), : Mean dbh (cm), : (cm) at the nth measurement, 3yr: 3 year as a measurement interval, HD ratio: Ratio of tree height to diameter of breast height (%), : Stand mean height (m).
본 연구에서는 상대밀도에 따른 임분의 고사목 본수 및 발생비율, 평균 흉고직경 생장량, 형상비 변화를 분석하였다. 분석자료는 상대밀도 범위별 집단 간의 평균 차이를 통계적으로 검정하기 위해 t검정(t-test) 및 일원배치 분산분석(One-way ANOVA)을 실시하였다. 반복 측정된 자료는 각 시기별 인자를 활용하여 분석하였으며, 이를 통해 수종별 적정 임분밀도관리기준을 선정하였다. 모든 통계적 분석은 R 통계 소프트웨어 version 4.3.2를 이용하였다(R core team, 2023).
결과 및 고찰
1. 임분제원현황
본 연구자료를 이용하여 임분밀도에 영향을 받는 생장인자들을 추가적으로 분석하였다(Table 2). 고사목은 소나무의 경우 0-175 trees/ha, 잣나무 0-295 trees/ha, 낙엽송 0-257 trees/ha로 분포하였으며, 평균은 7 trees/ha, 6 trees/ha, 11 trees/ha이었다. 평균 흉고직경 생장량의 경우 소나무 0.1-1.5 cm/year, 잣나무 0.1-1.4 cm/year, 낙엽송 0.1-1.1 cm/year로 나타났으며, 평균은 0.6 cm/year, 0.6 cm/year, 0.4 cm/year로 분석되었다. 평균 형상비의 경우 소나무 41.7-95.3%, 잣나무 40.9-87.8%, 낙엽송 58.7-130.0%로 분포하였고, 평균은 59.8%, 63.4%, 89.3%로 나타났다. 형상비의 분포는 선행연구와 유사하였으며, 낙엽송의 형상비가 높게 나타난 것은 다른 수종보다 흉고직경 생장 대비 수고 생장이 월등하게 높은 것으로 사료된다(Kang et al., 2019; Lee et al., 2022; Seo et al., 2023).
Table 2.
Summary statistics of density measures, mortality, DBH growth and HD ratio for species in this study.
|
Species |
Statistics |
Maximum stand density indexb) (trees/ha) |
Stand density index (trees/ha) |
Relative density |
Mortality (trees/ha) |
Mean DBH growth (cm/year) |
Height-diameter (HD) ratio (%) |
|
Pinus densiflora (na)=380) |
Mean |
1041 |
640 |
0.61 |
7 |
0.6 |
59.8 |
|
Std. Dev. |
261 |
0.25 |
21 |
0.4 |
8.6 |
|
Minimum |
161 |
0.26 |
0 |
0.1 |
41.7 |
|
Maximum |
1597 |
1.53 |
175 |
1.5 |
95.3 |
|
Pinus koraiensis (n=414) |
Mean |
1089 |
660 |
0.61 |
6 |
0.6 |
63.4 |
|
Std. Dev. |
243 |
0.26 |
22 |
0.2 |
8.9 |
|
Minimum |
248 |
0.23 |
0 |
0.1 |
40.9 |
|
Maximum |
1756 |
1.61 |
295 |
1.4 |
87.8 |
|
Larix kaempferi (n=484) |
Mean |
1005 |
588 |
0.59 |
11 |
0.4 |
89.3 |
|
Std. Dev. |
190 |
0.19 |
32 |
0.5 |
11.9 |
|
Minimum |
128 |
0.13 |
0 |
0.1 |
58.7 |
|
Maximum |
1158 |
1.15 |
257 |
1.1 |
130.0 |
Download Excel Table
임분밀도지수는 소나무의 경우 161-1597 trees/ha, 잣나무 248-1756 trees/ha, 낙엽송 128-1158 trees/ha로 분포하였으며, 평균 임분밀도지수(SDI)는 소나무 640 trees/ha, 잣나무 660 trees/ha, 낙엽송 588 trees/ha으로 나타났다. 상대밀도는 소나무 0.26-1.53, 잣나무 0.23-1.61, 낙엽송 0.13-1.15로 나타났으며, 평균 상대밀도는 소나무 0.61, 잣나무 0.61, 낙엽송 0.59로 분석되었다. 임분밀도지수는 같은 수종 내에서 평균 흉고직경과 입목본수의 로그(Log)꼴의 기울기가 동일하다는 개념을 이용하여 각 임분이 평방평균흉고직경이 25 cm일 때의 입목본수로 표준화시킨 것이다(Reineke, 1933; Zeide, 2002; Pretzsch and Biber 2005; Zeide, 2005). 선행연구에서도 임분밀도지수를 활용하여 임령을 고려하지 않고 임분 간 밀도를 비교하는데 유효함을 보였다(Pretzsch and Biber, 2005; Burkhart, 2013; Yang and Burkhart, 2016; Lee and Choi, 2019). 따라서 본 연구 또한 상대밀도를 활용하면 임령 분포를 고려하지 않고 임분밀도를 비교할 수 있을 것으로 사료된다.
2. 상대밀도에 따른 고사목 분석
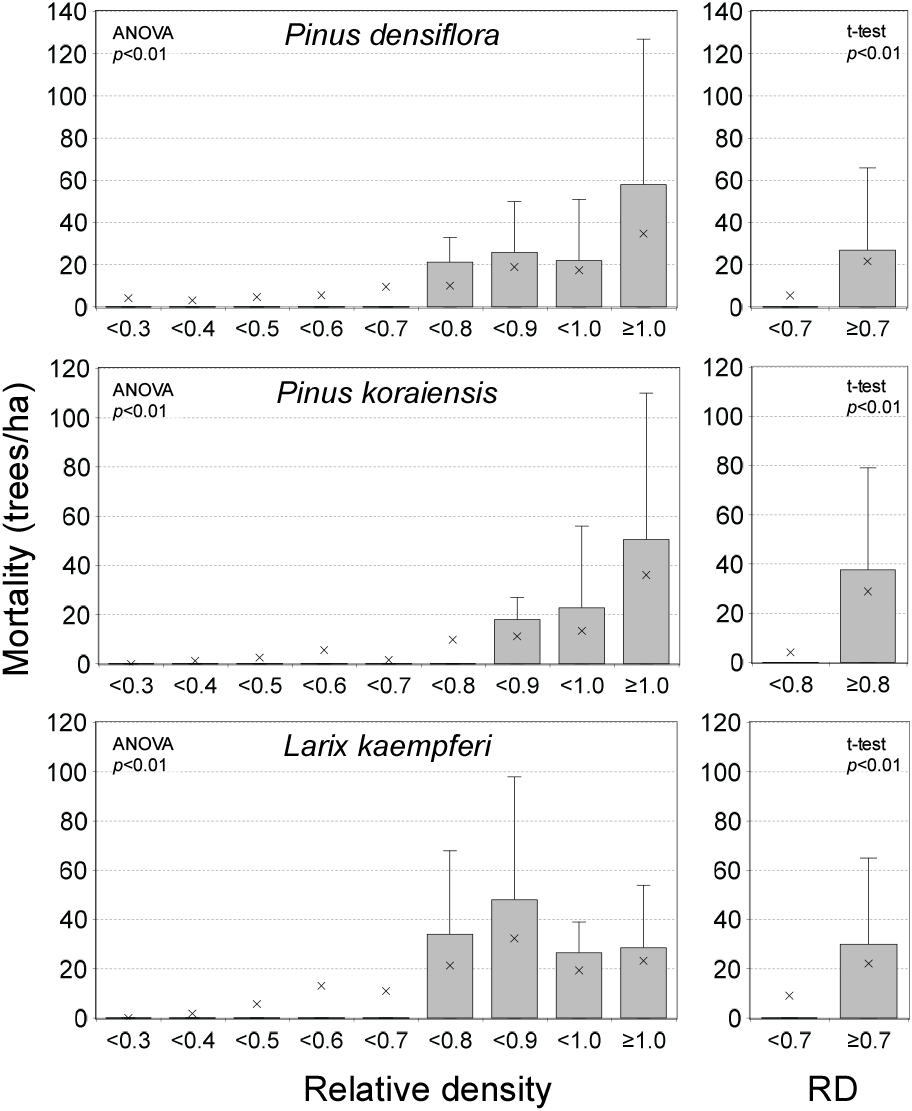
상대밀도에 따른 고사목을 분석한 결과, 상대밀도가 증가할수록 소나무, 잣나무, 낙엽송 임분 모두 고사목 본수가 증가하는 경향을 보였다(Figure 2). 특히 소나무와 낙엽송은 RD 0.7, 잣나무는 RD 0.8에서 고사목 본수가 급격하게 증가하였다. 해당 상대밀도를 기준으로 소나무, 낙엽송의 경우 RD<0.7 간벌구에서 평균 고사목은 각각 5 trees/ha, 8 trees/ha, RD≥0.7 간벌구는 평균 고사목이 22 trees/ha, 23 trees/ha로 나타났고, 잣나무의 경우 RD<0.8 간벌구에서는 평균 고사목이 4 trees/ha, RD≥0.8 간벌구는 평균 고사목이 28 trees/ha로 세 수종 모두 RD 0.7-0.8 이상에서 고사목이 유의적으로 많이 발생하였다(p<0.01).
Figure 2.
Stand mortality by species based on relative density (RD). The left column showed the mortality by the RD range of 0.1, and right column showed the mortality by two RD ranges where the difference was obvious by the criteria. ANOVA in left column and t-test in right column by species were all significant (p<0.01).
Download Original Figure
이는 밀도가 높은 임분에서 입목 간 경쟁이 심해 피압목들이 자연고사된 것으로 판단된다. 임분밀도에 따른 고사목을 분석한 선행연구에서도 임분밀도가 높을수록 고사목이 많이 발생하고 시간이 지남에 따라 고사목이 지속적으로 발생하였다고 보고된 바 있다(Mäkinen and Isomäki, 2004; Zhang et al., 2013; Lee et al., 2022). 따라서 본 연구대상지 중 임분밀도가 높은 간벌구는 지속적으로 고사목이 발생할 것으로 예상된다. 잣나무의 경우 다른 수종에 비해 고사목이 발생하는 상대밀도 기준이 높게 나타났다. 이는 잣나무가 소나무, 낙엽송과 같은 양수 수종보다 상대적으로 높은 내음성을 가지고 있어 낮은 광조건과 입목 간의 높은 경쟁에서 생장할 수 있기 때문이라고 사료된다(Korea Forest Research Institute, 2012; Korea Forest Service, 2000).
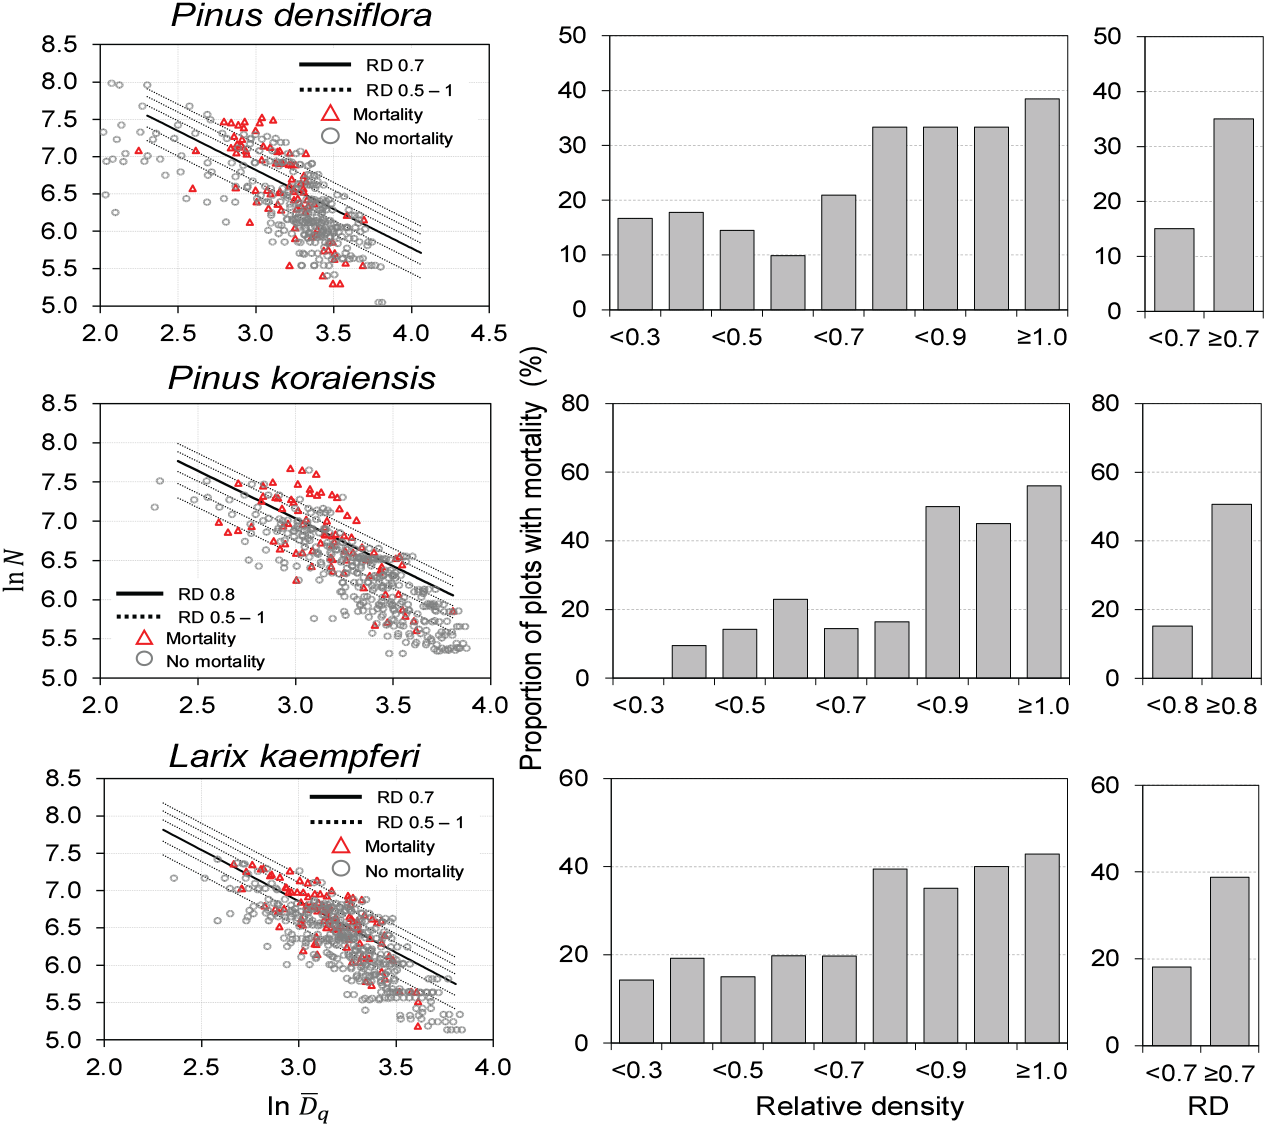
상대밀도에 따라 소나무, 잣나무, 낙엽송 임분의 고사목 발생 추이를 알아보기 위해 평방평균흉고직경()과 입목본수를 이용한 상대밀도선 위에 고사목이 발생하지 않은간벌구(No mortality)와 고사목이 발생한 간벌구(Mortality)의 관측값을 도시한 결과, 세 수종 모두 상대밀도가 증가함에 따라 고사목이 발생한 간벌구의 수가 증가하는 경향이 나타났다(Figure 3). 상대밀도별 고사목이 발생한 간벌구의 비율을 분석하였을 때, 소나무의 경우 RD<0.7 간벌구 중 9.8%-20.9%, RD≥0.7 간벌구 중 33.3%-38.4%에서 고사목이 발생하였다. 잣나무의 경우 RD<0.8 간벌구 중 6.5%-17.6%, RD≥0.8 간벌구 중 42.1%-56.0%에서 고사목이 발생하였다. 낙엽송은 RD<0.7 간벌구 중 7.6%-17.3%, RD≥0.7 간벌구 중 35.1%-42.8%에서 고사목이 발생하였다(p<0.01).
Figure 3.
Scatterplots of stand density (lnN) over quadratic mean diameter (ln) in logarithmic scale and mortality rate by species based on relative density (RD). The scatterplots represent the observations with RD lines by plot type where mortality occurred. The bar graphs represent the mortality rate by the RD ranges. The bar graphs represent the proportion of plots with mortality by the RD class.
Download Original Figure
위의 상대밀도에 따른 고사목 분석을 종합하였을 때, 경쟁으로 인한 자연고사 발생을 예방하기 위해서는 적정 임분밀도관리기준을 소나무와 낙엽송은 RD 0.7, 잣나무는 RD 0.8로 선정하고, 이 기준보다 밀한 임분의 경우 간벌을 통한 임분밀도 조절이 필요하다고 판단된다. 선행연구에서는 우리나라 소나무, 잣나무, 낙엽송의 상대입목축적도를 제작할 때 과밀도의 구분을 RD 0.7 이상으로 정하였고(Lee and Choi, 2019), 미국 북동부 침엽수림과 중국 전나무림의 최대임분밀도를 산출할 때 RD 0.7 이상의 임분을 자연고사가 발생할 정도로 충분히 밀하다고 판단하였다(Solomon and Zhang, 2002; Ge et al., 2017). 따라서 본 연구에서 적정 임분밀도관리기준 RD 0.7-0.8은 합당하다고 사료된다. 또한 우리나라 ‘산림의 기능별 숲가꾸기 기술’의 생산목표별 시업체계의 임분밀도와 비교하였을 때(Korea Forest Research Institute, 2014), 소나무의 우량중경재, 잣나무의 일반소경재, 낙엽송의 우량중경재와 일반소경재 시업체계가 본 연구의 기준보다 높은 상대밀도에서 수확하는 것으로 나타나 고사목 발생으로 입목 손실 위험이 있어, 향후 시업체계의 임분밀도에 관한 다양한 고찰이 요구된다.
3. 상대밀도에 따른 평균 흉고직경 생장량과 형상비 분석
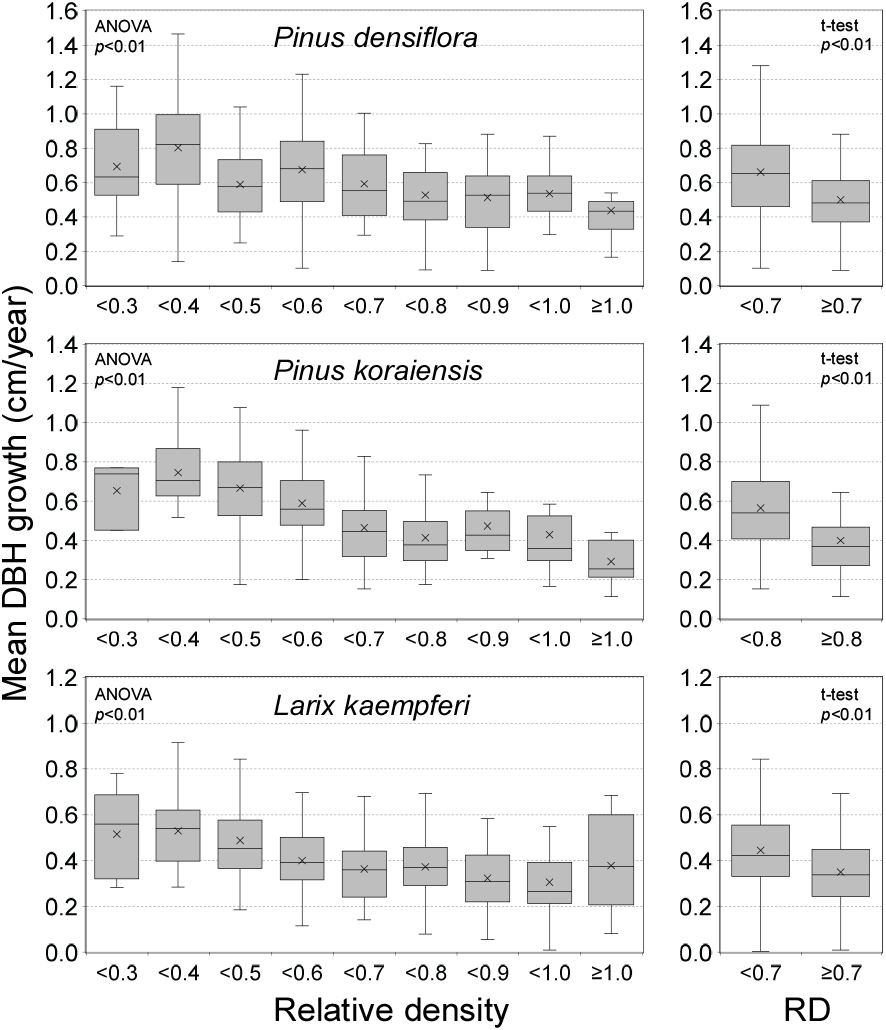
상대밀도에 따른 소나무, 잣나무, 낙엽송 임분의 흉고직경 생장량을 분석한 결과, 소나무의 경우 0.4-0.9 cm/year, 잣나무는 0.3-0.9 cm/year, 낙엽송은 0.3-0.7 cm/year로 나타났다(Figure 4). 세 수종 모두 상대밀도가 증가함에 따라 평균 흉고직경 생장량이 뚜렷하게 감소하는 경향을 보였다. 또한 소나무와 낙엽송 RD≥0.7, 잣나무 RD≥0.8 간벌구의 경우 소나무는 평균 흉고직경 생장량이 0.5 cm/year, 잣나무 0.3 cm/year, 낙엽송은 0.3 cm/year로 나타났다. 소나무와 낙엽송 RD<0.7, 잣나무 RD<0.8 간벌구의 경우 소나무는 0.7 cm/year, 잣나무는 0.6 cm/year, 낙엽송은 0.5 cm/year로 나타나 적정 임분밀도관리기준 RD 0.7-0.8에 따라 평균 흉고직경 생장량의 차이가 유의하였다(p<0.01).
Figure 4.
Mean DBH growth by species based on relative density (RD). The left column showed the mean DBH growth by the RD range of 0.1, and right column showed the mean DBH growth by two RD ranges where the difference was obvious by the criteria. ANOVA in left column and t-test in right column by species were all significant (p<0.01).
Download Original Figure
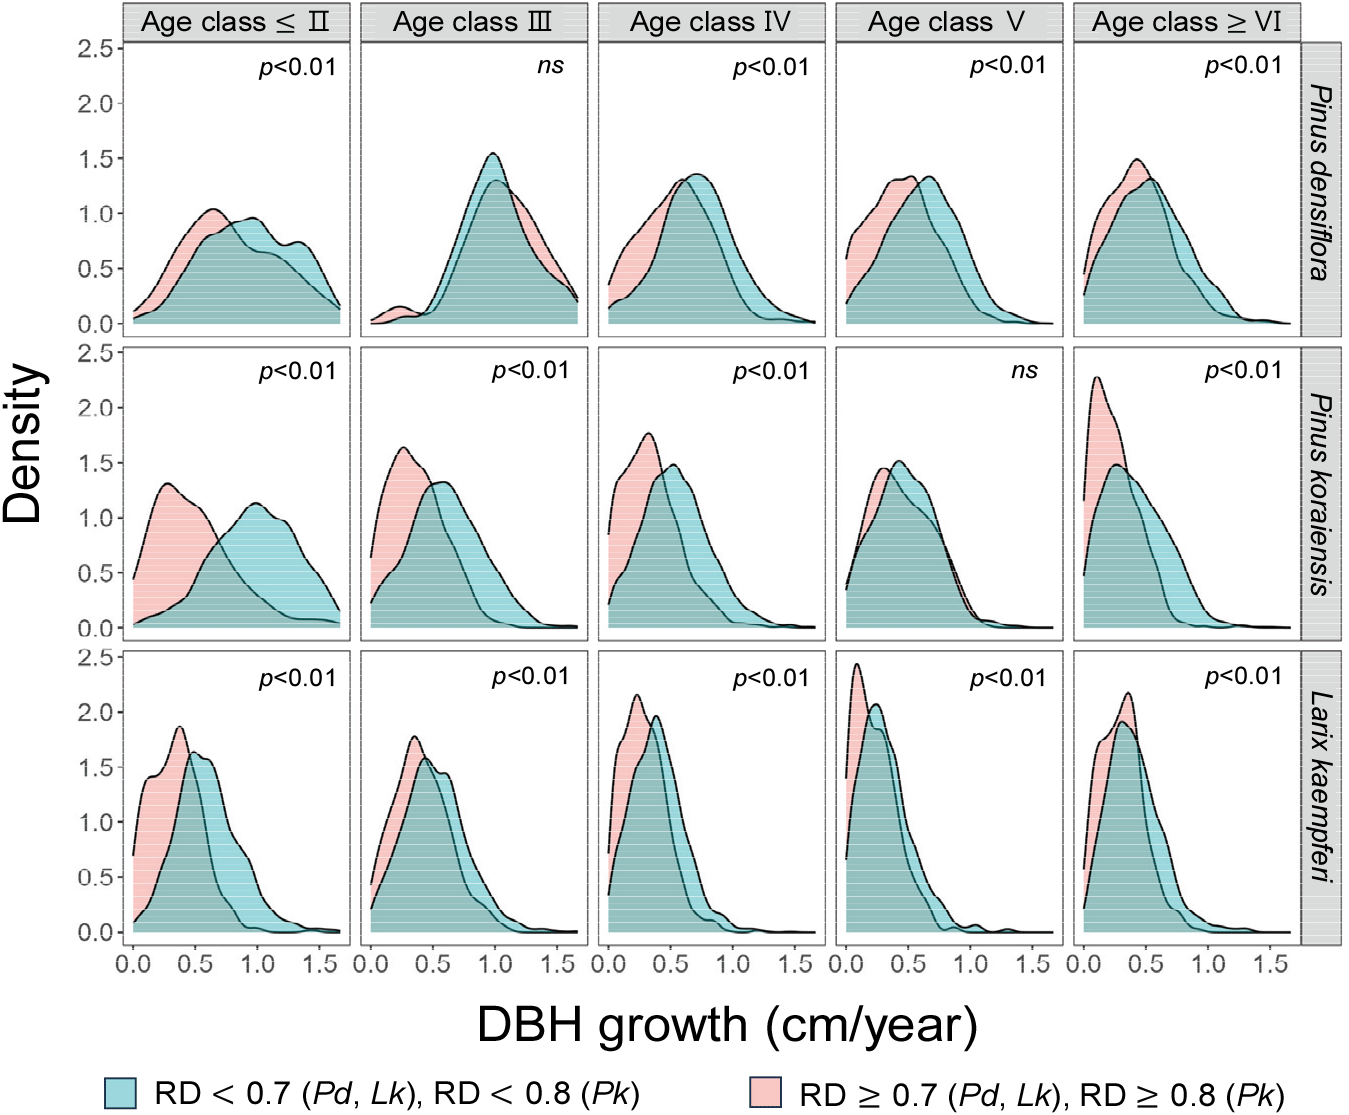
또한 상대밀도에 따른 영급별 평균 흉고직경 생장량의 분포를 도시한 결과, 소나무와 낙엽송 RD≥0.7, 잣나무 RD≥0.8 간벌구의 경우 소나무는 평균 흉고직경 생장량이 0.5-1.1 cm/year, 잣나무는 0.3-0.5 cm/year, 낙엽송은 0.3-0.4 cm/year로 나타났다(Figure 5). 반면, 소나무와 낙엽송 RD< 0.7, 잣나무 RD<0.8 간벌구의 경우 소나무는 0.6-1.0 cm/year, 잣나무는 0.4-1.0 cm/year, 낙엽송은 0.3-0.6 cm/year로 나타났다. 평균 흉고직경 생장량은 적정 임분밀도관리기준 RD 0.7-0.8보다 낮은 간벌구에서 유의적으로 높았으며, 영급이 낮을수록 상대밀도에 따른 차이가 컸다(p<0.01). 본 연구결과에 따라 간벌을 통하여 적정 임분밀도관리기준인 소나무와 낙엽송은 RD 0.7, 잣나무는 RD 0.8 이하로 임분밀도를 관리한다면 고사목을 감소시키는 동시에 평균 흉고직경 생장 촉진 효과를 얻을 수 있다고 판단된다.
Figure 5.
DBH growth according to density management criteria by age class. The legend was divided into two groups according to the adequate density management criteria determined in this study. The t-test in each case by age class and species was significant (p<0.01) except for the case in age class III of Pinus densiflora and age class V of Pinus koraiensis (ns, not significant). Pd is Pinus densiflora, Pk is Pinus koraiensis, Lk is Larix kaempferi.
Download Original Figure
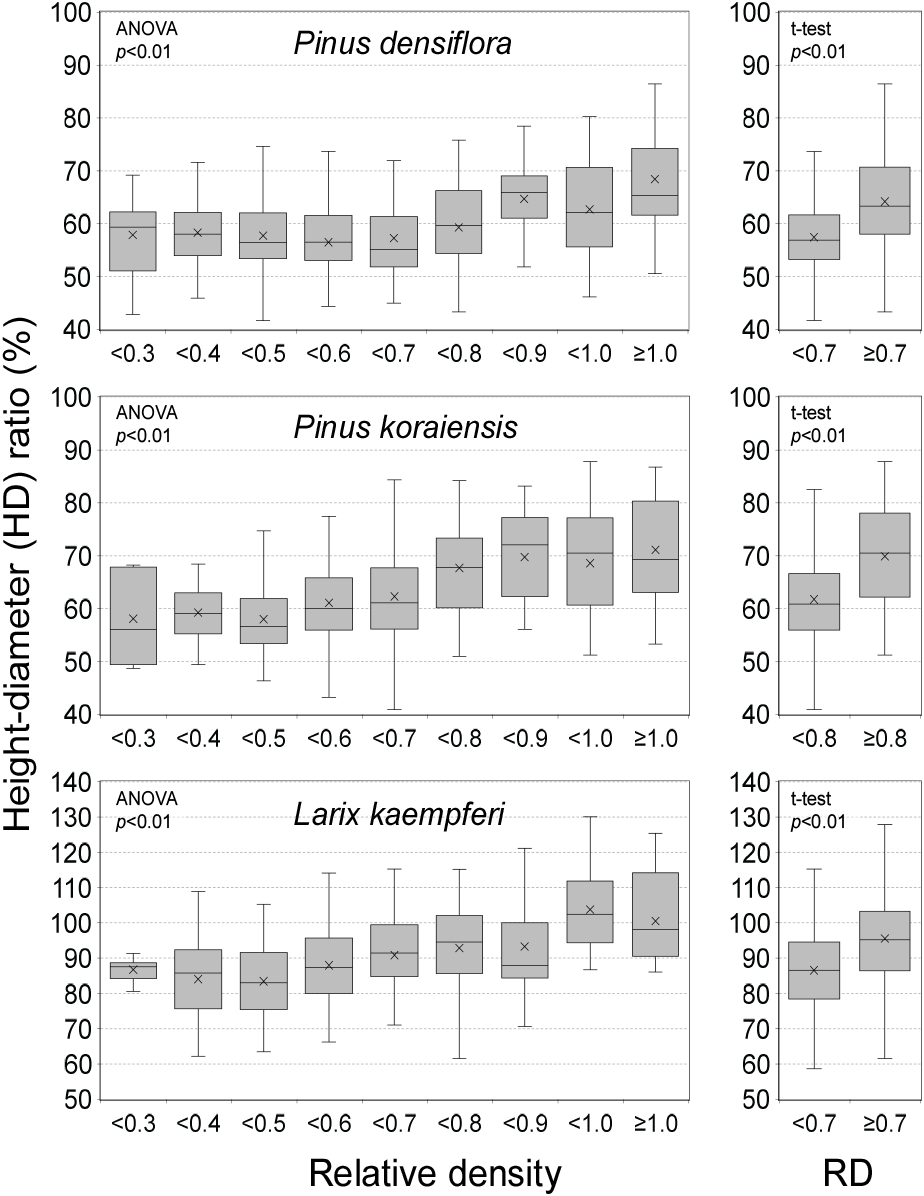
상대밀도에 따른 소나무, 잣나무, 낙엽송 임분의 형상비를 분석한 결과, 소나무의 형상비는 41.7%-93.8%, 잣나무 40.9%-87.8%, 낙엽송 58.7%-130.1%로 상대밀도가 증가함에 따라 증가하는 경향이 나타났다(Figure 6). 소나무와 낙엽송 RD≥0.7, 잣나무 RD≥0.8 간벌구의 경우 소나무는 평균 형상비가 69.9%, 잣나무 70.0%, 낙엽송은 91.0%로 나타났다. 소나무와 낙엽송 RD<0.7, 잣나무 RD<0.8 간벌구의 경우 소나무는 61.7%, 잣나무는 61.8%, 낙엽송은 88.8%로 나타나 적정 임분밀도관리기준 RD 0.7-0.8에 따라 형상비의 차이가 유의하였다(p<0.01).
Figure 6.
Height-diameter (HD) ratio by species according to the relative density (RD). The left column showed the HD ratio by the RD range of 0.1, and right column showed the HD ratio by two RD ranges where the difference was statistically significant by the criteria. ANOVA in left column and t-test in right column by species were all highly significant (p<0.01).
Download Original Figure
Park et al.(2009)는 해안 임분이 밀할수록 형상비가 높아진다고 보고하였고, Park(2016)에서는 임분밀도가 증가함에 따라 소나무림의 형상비 70%의 개체목 비율이 증가하여 이를 관리하기 위해 간벌이 필요하다고 언급하였다. 또한 형상비가 70% 이상인 임분의 경우 풍해 및 설해에 취약하다고 알려져 있다(Korea Forest Conservation Association, 2008). 따라서 소나무와 잣나무의 경우 적정 임분밀도관리기준 RD 0.7-0.8 이하로 관리하는 것이 형상비를 70% 미만으로 유지하여 임분의 건정성을 확보할 수 있다고 판단된다. 낙엽송의 경우 RD 0.7 이하의 평균 형상비가 70% 이상으로 나타났지만, 상대밀도에 따른 형상비의 차이가 유의하였고, 본 연구결과들을 종합하였을 때 적정 임분밀도관리기준 RD 0.7이 합당하다고 사료된다.
결 론
본 연구는 우리나라 소나무, 잣나무, 낙엽송 인공림의 적정 임분밀도관리기준을 제시하고자 임분밀도지수 중 하나인 상대밀도(RD)를 통해 고사목 빈도, 평균 흉고직경 생장량 및 형상비 분석을 실시하였다. 분석 결과, 적정 상대밀도는 소나무와 낙엽송의 경우 RD 0.7, 잣나무의 경우 RD 0.8로 제시되었다. 적정 상대밀도보다 높은 간벌구에서 평균 15-24 trees/ha의 고사목이 발생하였으며, 고사목 발생비율은 20.0%-35.4% 더 높았다.
평균 흉고직경 생장량은 임분의 상대밀도가 증가함에 따라 수종별 0.2-0.5 cm/year가 감소하는 경향을 보였다. 각 영급에서 상대밀도가 낮을수록 평균 흉고직경 생장량은 높았으며, 영급이 낮을수록 상대밀도에 따른 평균 흉고직경 생장량 차이는 크게 나타났다. 형상비의 경우 상대밀도가 높을수록 46.9%-71.4%가 유의적으로 증가하였다. RD 0.7-0.8을 기준으로 분석한 경우, 평균 흉고직경 생장량과 형상비에서도 유의적인 차이가 나타났다.
종합적으로 소나무림과 낙엽송림은 RD 0.7, 잣나무림은 RD 0.8을 적정 임분밀도관리기준으로 선정한다면, 고사목 발생을 억제하고, 직경 생장을 촉진하여 양질의 목재생산이 가능할 것이라 분석되었다. 따라서 본 연구는 소나무, 잣나무, 낙엽송 경제림을 대상으로 간벌이 필요한 임분을 판단하여 밀도를 관리하고, 시업체계를 개선하는데 기초자료로 사용될 것으로 기대된다. 앞으로도 목재생산을 위해 인공림 장기 모니터링 데이터를 통한 실증적인 생장·수확연구가 지속되길 바란다.
감사의 글
본 연구는 산림청(한국임업진흥원) 산림과학기술 연구개발사업 (No. 2022464B10-2424-0201)과 교육부(한국연구재단) 기초연구사업(No. NRF-2016R1D1A1B02011648)의 지원을 받아 수행되었습니다.
References
Burkhart, H.E. 2013. Comparison of maximum size-density relationships based on alternate stand attributes for predicting tree numbers and stand growth. Forest Ecology and Management 289: 404-408.


Choi, J., Lee, B., Lee, D. and Choi, I. 2014a. Growth monitoring of Korean white pine (
Pinus koraiensis) plantation by thinning intensity. Journal of Korean Forest Society 103(3): 422-430.


Choi, J., Lee, D., Seo, Y. and Choi, I. 2014b. Investigation of thinning experimental plots(1),(2) of Korean white pine stand(II). Journal of Research Forest of Kangwon National University 34: 1-26.

Ge, F., Zeng, W., Ma, W. and Meng, J. 2017. Does the slope of the self-thinning line remain a constant value across different site qualities?—An implication for plantation density management. Forests 8(10): 355.


Hynynen, J. 1993. Self-thinning models for even-aged stands of
Pinus sylvestris,
Picea abies and
Betula pendula. Scandinavian Journal of Forest Research 8: 326-336.


Jung, S.Y., Lee, K.S., Kim, H.S. and Park, J.H. 2024. Improvement of the Thinning System by Exploring the stand density management criteria for
Chamaecyparis obtusa in South Korea. Journal of Korean Society of Forest Science 113(1): 131-142.

Kang, J.T., Ko, C.U., Yim, J.S., Lee, S.J. and Moon, G.H. 2019. Estimating tree shape ratio by region for
Pinus densiflora and
Larix kaempferi in Korea. Journal of Korean Society of Forest Science 108(4): 600-609.

Kang, J.T., Son, Y.M., Yim, J.S. and Jeon, J.H. 2016. Estimation of carbon stock and uptake for
Larix kaempferi Lamb. Journal of Climate Change Research 7(4): 499-506.


Kim, M.I., Lee, W.K., Choi, G.M., Song, C., Lim, C.H., Moon, J., Piao, D., Kraxner, F., Shividenko, A. and Forsell, N. 2017. Modeling stand-level mortality based on maximum stem number and seasonal temperature. Forest Ecology and Management 386: 37-50.


Korea Forest Conservation Association. 2008. Forest environmental education material III forest conservation. Korea Forest Conservation Association, Daejeon, Korea. pp. 113.

Korea Forest Research Institute. 2012. Commercial species 3
Pinus Koraiensis. Korea Forest Research Institute, Seoul, Korea. pp. 168.

Korea Forest Research Institute. 2014. Forest Management Techniques by Function. Korea Forest Research Institute, Seoul, Korea. pp. 154.

Korea Forest Research Institute. 2015. Thinning and Target Forest Type. Korea Forest Research Institute, Seoul, Korea. pp. 156.

Korea Forest Service. 2000. Forest and Forestry Technique. Korea Forest Service, Daejeon, Korea. pp. 272.

Korea Forest Service. 2022. Promotion Strategy for ‘Forest Renaissance’ through Advanced Country Style Forest Management and Governance. Korea Forest Service, Daejeon, Korea. pp. 29.

Lee, D. and Choi, J. 2019. Evaluating maximum stand density and size-density relationships based on the competition density rule in Korean pines and Japanese larch. Forest Ecology and Management 446: 204-213.


Lee, D. and Choi, J. 2020. Stocking diagrams for silvicultural guideline in Korean pines and Japanese larch. Forests 11(8): 833.


Lee, D., Jung, S. and Choi, J. 2022. Analysis of tree growth characteristics by first and second thinning in Korean white pine plantation. Journal of Korean Society of Forest Science 111(1): 150-164.

Lee, W.K., Seo, J.H. and Bae, S.W. 2000, Maximum stem number and mortality model for even-aged
Pinus densiflora stand in Kangwon-Province, Korea. Journal of Korean Society of Forest Science 89(5): 634-644.

Nyland, R.D. 1996. Silviculture: Concepts and Applications. McGraw-Hill, New York, pp 633.

Mäkinen, H. and Isomäki, A. 2004. Thinning intensity and growth of Scots pine stands in Finland. Forest Ecology and Management 201(2-3): 311-325.


Park, C.M., Kim, S.W. and Park, S.H. 2009. Study on growth characteristics of
Pinus thunbergii windbreak forests around Goosipo Beach, Gochang-gun. Korean Journal of Environment and Ecology 23: 365-375.

Park, G.D. 2016. Studies on forest stand management of
pinus thunbergi in Jeju Island. Doctoral dissertation, Kangwon National University, Kangwon, Korea. pp. 117.

Park, J.H., Jung, S.Y., Yoo, B.O., Lee K.S., Park Y.B. and Kim. H.H. 2017. The production objectives and optimal standard of density control using stand density management diagram for
pinus densiflora forests in Korea. Journal of Korean Society of Forest Science 106(4): 457-464.

Park, J.H., Chung, S.H., Kim, S.H. and Lee, S.T. 2020. Optimum stand density control considering stability in
Larix kaempferi forests. Journal of Korean Society of Forest Science 109(2): 202-210.

Pretzsch, H. and Biber, P. 2005. A re-evaluation of Reineke’s rule and stand density index. Forest Science 51(4): 304–320.


R Core Team. 2023. R: a Language and environment for statistical computing. Vienna, Austria: R Core Team.

Rantala, S. 2011. Finnish Forestry: Practice and Management. Metsäkustannus Oy, Finland.

Reineke, L.H. 1933. Perfecting a stand-density index for even-aged forests. Journal of Agricultural Research 46(7): 627-638.

Seo, Y., Lee, D. and Choi, J. 2023. Developing and comparing individual tree growth models of major coniferous species in South Korea based on stem analysis data. Forests 14(1): 115.


Shin, J.H., Han, H., Ko, C.U., Kang, J.T. and Kim, Y.W. 2022. Applying nonlinear mixed-effects models to taper equations: a case study of
Pinus densiflora in Gangwon Province, Republic of Korea. Journal of Korean Society of Forest Science 111(1): 136-149.

Smith, D.M. 1986. The Practice of Silviculture. 8th edition. Wiley, New York, pp 527.

Son, Y.M., Jeon, J.H., Lee, S.J., Yim, J.S. and Kang, J.T. 2017. Development of estimated equation for mortality rates by forest type in korea. Journal of Korean Forest Society 106(4): 450-456.

Solomon, D.S. and Zhang, L. 2002. Maximum size-density relationships for mixed softwoods in the northeastern USA. Forest Ecology and Management 155(1-3): 163-170.


Sterba, H. 1987. Estimating potential density from thinning experiments and inventory data. Forest Science 33(4): 1022–1034.


VanderSchaaf, C.L. and Burkhart, H.E. 2007. Comparison of methods to estimate Reineke’s maximum size-density relationship species boundary line slope. Forest Science 53(3): 435-442.


Vospernik, S. and Sterba, H. 2015. Do competition-density rule and self-thinning rule agree?. Annals of Forest Science 72: 379-390.


Williams, R.A. 1996. Stand density index for loblolly pine plantations in north Louisiana. Sorthern Journal of Applied Forestry 20(2): 110-113.


Williams, R.A. 2003. Use of stand density index as an alternative to stocking percent in upland hardwoods. Northern Journal of Applied Forestry 20(3): 137-142.


Yang, S. and Burkhart, H.E. 2017. Estimation of carrying capacity in loblolly pine (
Pinus taeda L.). Forest Ecology and Management 385: 167-176.


Zeide, B. 2002. Density and the Growth of Even-Aged Stands. Forest Science 48(4): 743-754.


Zeide, B. 2005. How to measure stand density. Trees 19: 1-14.


Zhang, J., Ritchie, M.W., Maguire, D.A. and Oliver, W.W. 2013. Thinning ponderosa pine (
Pinus ponderosa) stands reduces mortality while maintaining stand productivity. Canadian Journal of Forest Research 43(4): 311-320.


