Journal of Korean Society of Forest Science
Korean Society of Forest Science
Article

한국형 i-Tree Eco를 활용한 산림미세먼지측정넷 조사지의 환경·생태적 가치 평가

최수민, 여재호, 김채완, 박찬열*https://orcid.org/0000-0003-3543-387X
Sumin Choi, Jae Ho Yeo, Cha-wan Kim, Chan-Ryul Park*https://orcid.org/0000-0003-3543-387X
국립산림과학원 생활권도시숲연구센터
Livable Urban Forest Research Center, National Institute of Forest Science, Seoul 02455, Korea
*Corresponding Author E-mail: maeulsoop@korea.kr

© Copyright 2025 Korean Society of Forest Science. This is an Open-Access article distributed under the terms of the Creative Commons Attribution Non-Commercial License (http://creativecommons.org/licenses/by-nc/4.0/) which permits unrestricted non-commercial use, distribution, and reproduction in any medium, provided the original work is properly cited.

Received: Nov 01, 2024; Revised: Jan 25, 2025; Accepted: Jan 31, 2025

Published Online: Jun 30, 2025

요 약

i-Tree Eco는 현장 수목 조사, 대기 오염 및 기상 자료를 기반으로 도시 숲의 구조, 환경적 영향, 그리고 이들의 가치를 정량화할 수 있는 소프트웨어이다. 본 연구는 한국형 i-Tree Eco를 활용하여 산림 미세먼지 측정넷 15개소를 대상으로 각 지점별 도시숲의 대기오염물질 제거, 탄소 저장 및 흡수량, 산소 생산, 홍수 방지량과 이의 경제적 가치를 평가했다. 그 결과 대기오염물질 제거의 경우 울산(504.61 kg/yr/ha), 경제적 가치는 고양(71,333,333원)에서 가장 높은 값을 보였다. 그리고 시흥에서 탄소 저장량(210.22 metric tons/ha, 48,000,000 원/ha)과 탄소 흡수량(12.59 metric tons/yr/ha, 2,866,667 원/yr/ha), 산소생산량(33.56 t/yr/ha), 구조자산 가치(803,333,333 원/ha)가 가장 높게 산정되었다. 홍수 방지량은 울산(783.33 m3/yr/ha, 2,205,556 원/yr/ha)이 가장 높았다. i-Tree Eco 평가 결과의 유효성을 판단하기 위해, 국내 도시 녹지 탄소 흡수량식을 활용한 결과와 비교한 결과 유의미한 상관관계(R2=0.60)를 얻었다. 향후, 국내에서 다양한 지역의 현장 결과를 적용하여 한국형 i-Tree 모형을 개선하고, 국외 결과를 비교하여 도시숲의 환경생태적 가치 평가에 국제적 비교가 필요하다.

Abstract

The software tool i-Tree Eco can quantify urban forest structure, environmental effects, and economic value using field tree surveys, air pollution data, and weather information. This study evaluated the benefits of urban forests, including air pollution removal, carbon storage and sequestration, oxygen production, and avoided runoff, at 15 “Asian Initiative for Clean Air Networks” stations using i-Tree Eco. Results showed that Ulsan had the highest air pollution removal (504.61 kg/year/ha) and avoided runoff (783.33 m3/year/ha and 2,205,556 won/year/ha), whereas Goyang recorded the highest economic value (71,333,333 won). Siheung had the highest carbon storage (210.22 metric tons/ha and 48,000,000 won/ha), carbon sequestration (12.59 metric tons/year/ha and 2,866,667 won/year/ha), oxygen production (33.56 tons/year/ha), and replacement value (803,333,333 won/ha). A comparative analysis using the domestic green carbon sequestration equation confirmed a significant correlation with i-Tree Eco results (R2 = 0.60). To enhance the Korean i-Tree model, future research should incorporate field data from diverse regions and compare findings internationally to better assess the environmental and ecological value of urban forests.

Keywords: i-Tree Eco; air pollutants removal; carbon storage; carbon sequestration

서 론

급속한 도시화로 인해 도심 내 환경 문제가 발생하고 있다(Uttara et al., 2012). 운송, 에너지 생산 및 기타 인간 활동을 위한 화석 연료의 연소는 오존, 일산화탄소, 이산화황, 질소산화물, 미세먼지 등과 같은 대기오염물질을 발생시키고(Cohen et al., 2004), 이는 인체와 환경에 악영향을 줄 수 있다(Ghorani-Azam et al., 2016). 더불어 이산화탄소와 같은 온실가스도 배출하는데, 이는 기후변화의 큰 주범이기도 하다(Ramanathan and Feng, 2009).

이러한 도시내 환경문제를 줄이는 한 가지 방법은 도시 녹화를 통한 것이며, 많은 국가에서 나무를 심어 도시를 녹화하는 정책을 수행하고 있다(McPherson et al., 2001). 도심 내 녹지는 대기오염물질을 완화하는데 중요한 역할을 한다(Nowak et al., 2002a; Bottalico et al., 2016; Endreny et al., 2017). 나무는 잎 기공으로 흡입하거나 식물 표면을 통해 대기오염물질을 제거하고(Nowak et al., 2006a), 광합성을 통해 탄소를 고정(fixing)하고 여분의 탄소를 바이오매스 형태로 저장함으로써 탄소 흡수원으로의 기능을 한다(Nowak and Crane, 2002b). 이처럼 환경 오염 문제를 해결하고 다양한 순기능을 향상하는 도시숲의 긍정적 효과를 이해하고 정량화하는 것은 도심 내 식생을 관리하는데 중요한 정보이다(Nowak and Crane, 2000; Myeong et al., 2006).

도시 환경질을 개선하는 도시숲의 영향을 평가하는 모델은 현장에 실효적으로 적용가능한 식재 계획을 제시하고, 기존에 조성된 숲을 우선적으로 유지·관리할 지역을 파악하여(Lin, 2020), 한정된 예산에서 도시숲의 전반적 관리 체계를 개선하고 산림자원의 혜택을 정량화하여 표출할 수 있다(Nowak et al., 2006a).

이에 도시숲을 정량적으로 평가하기 위한 연구들이 실행되었다. 2008년 스페인 바르셀로나 내 수목을 대상으로 i-Tree Eco를 활용하여 월별, 오염물질별 대기 오염 제거, 탄소 저장량 등을 정량화하는 연구가 있었으며(Baró et al., 2014), 영국 런던 시내의 수목을 대상으로 i-Tree를 활용하여 환경적 가치를 평가한 연구 사례(Farrell, 2015)가 있다. 또한 미국의 백만 그루 프로젝트, 호주 도시의 캐노피 평가 및 커뮤니티 참여, 유럽 전역의 지방자치단체에서 i-Tree를 도시녹지를 가치 있게 평가하는 방법으로 사용하고 있다.

국립산림과학원은 미 농림부와 Davey Institutes와 협력하여 한국의 대기오염농도 및 기상 정보를 i-Tree Eco에 업데이트하고 국내 다양한 지역을 대상으로 도시숲의 환경·생태적 가치의 평가를 시도하고 있다.

본 연구는 국내 산림미세먼지측정넷 15개소를 대상으로, i-Tree Eco를 활용하여 해당 지역 내 도시숲의 대기오염물질 제거량, 탄소 저장량 및 흡수량, 산소 생산량, 유수 유출 방지량, 구조자산가치(Replacement values)를 추정하여 도시숲의 환경 개선 효과를 평가했다. 이후 국내 기존의 탄소 흡수량 식을 통해 계산한 값과 비교 검토하여 i-Tree Eco의 평가 값을 비교하였다. 본 연구의 결과는 향후 국내 도시 녹지 평가 시 i-Tree Eco를 적용하는 것에 긍정적인 영향을 줄 수 있을 것으로 판단된다.

재료 및 방법

1. 조사 대상지

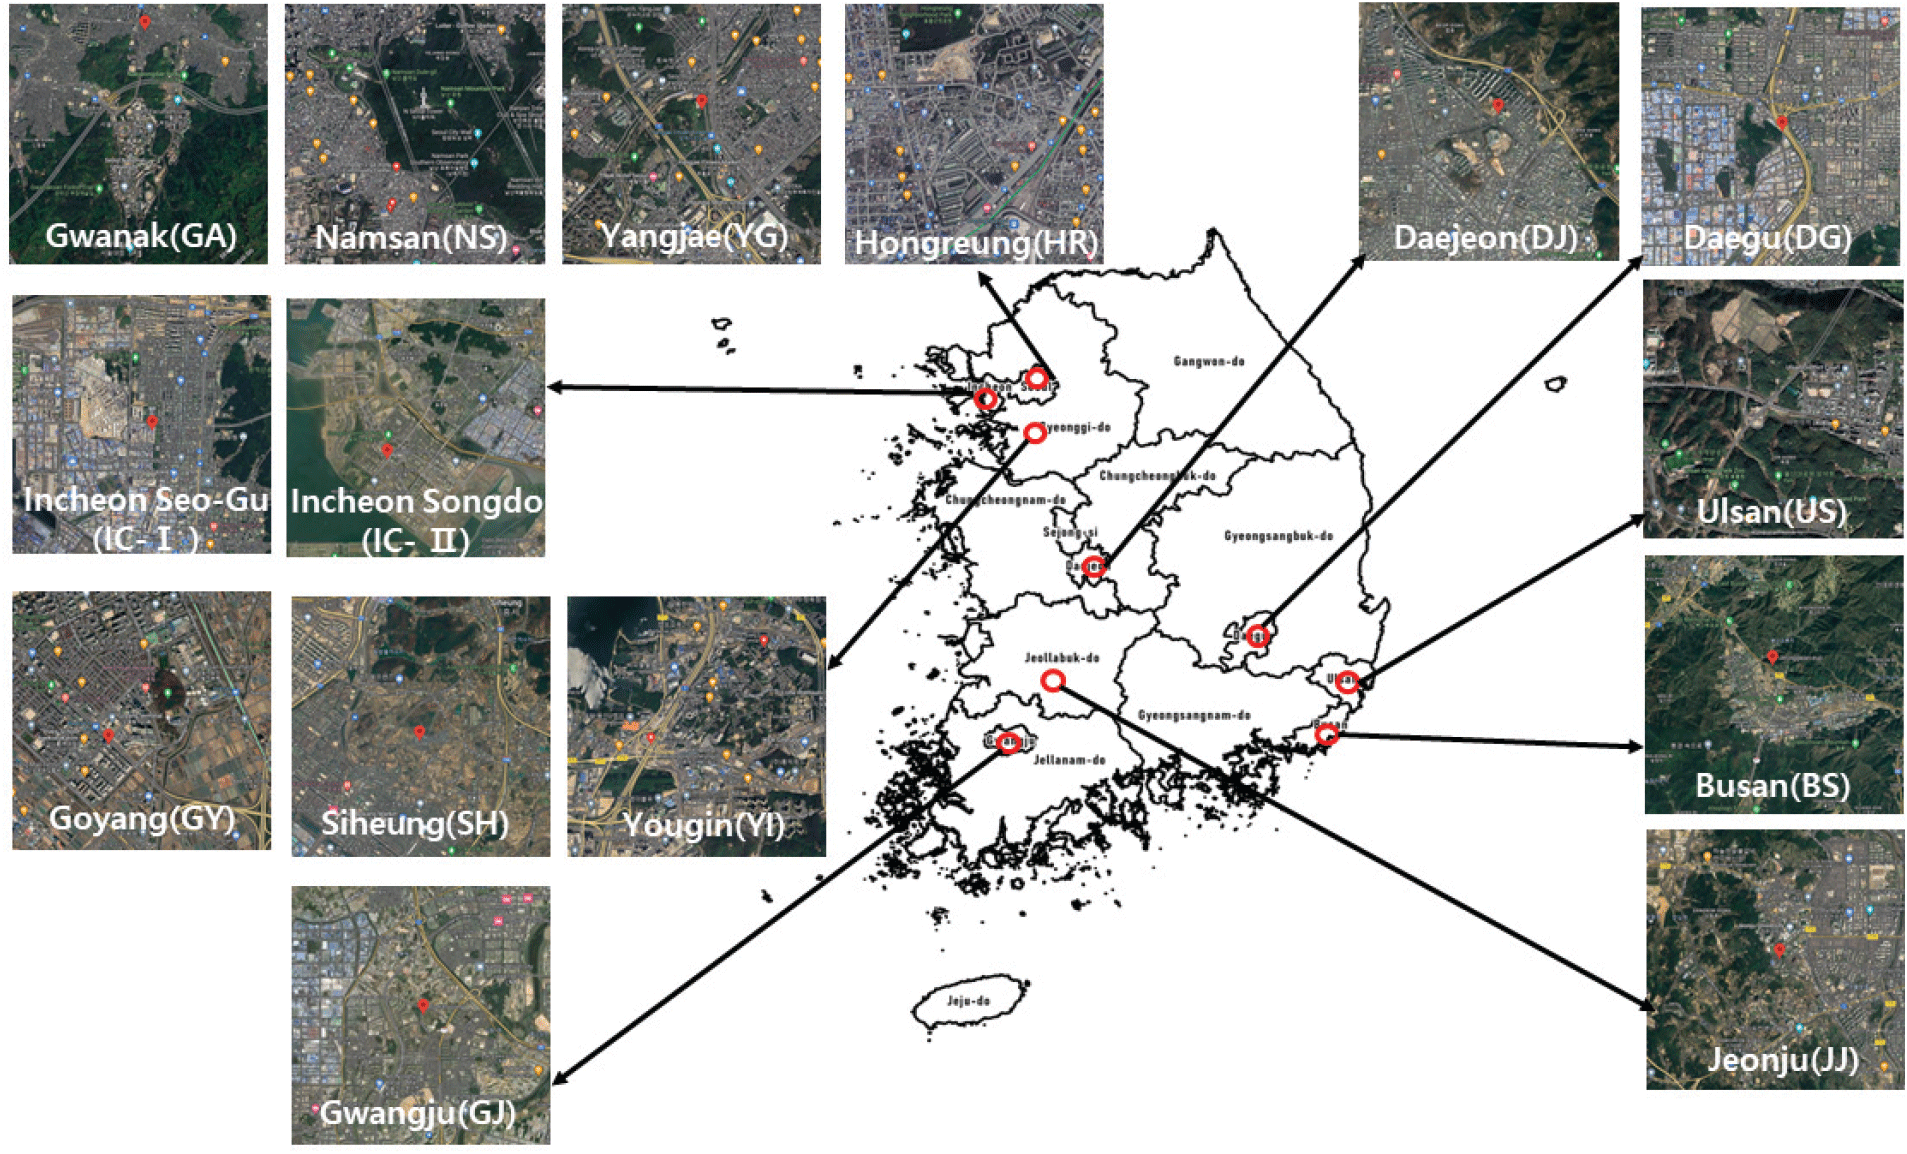
2019년부터 2023년까지 국립산림과학원은 도시숲과 산림의 미세먼지 저감효과를 측정하기 위해 전국 44개소 132지점에 산림미세먼지측정넷을 구축하였다. 측정넷은 주풍방향 및 주변환경 조사를 통한 적지선정을 통해 1개소당 주거지-오염원-산림(도시숲)의 3개 지점에 설치하였다. 또한, 관측 데이터의 분석을 위해 2021년까지 설치된 측정넷 주변의 그린인프라를 조사하여 보고하였고(Choi et al., 2021), 본 연구는 그린인프라 조사지역 중 도시내 생활권에 위치한 도시숲과 공원 등 15개소(관악, 남산, 양재, 홍릉, 고양, 시흥, 용인, 광주, 대구, 대전, 부산, 울산, 인천 서구, 인천 송도, 전주, Figure 1)를 대상으로 하였다.

jksfs-114-1-1-g1
Figure 1. The Location of AiCAN’s Fifteen Station for Field Survey.
Download Original Figure
2. 각 지점별 수목 조사 및 입력값

i-Tree Eco를 활용하여 수목의 탄소저장량, 대기오염물질제거 등의 항목에서 평가하기 위해서는 수목에 대한 자세한 데이터를 입력해야 한다(Table 1)이다. 특히, 탄소저장량을 산정하기 위해서는 수목 기본정보 이외에도 수목명, 낙엽성인지 상록성인지, 상대생장식 등이 입력되어야 한다. i-Tree Eco에는 기존에 누락되었던 국내 몇 수종에 대한 상대식과 수종에 대한 정보가 반영되어 있어 국내 실정에 맞게 평가할 수 있도록 구성되어 있다. 본 연구에서는 각 지점별 수목조사한 데이터를 입력하여 분석을 했으며, 현장수목조사 항목 및 방법은 ‘i-Tree Eco 기반 도시숲의 가치 평가 및 조사 방법(Gwak et al., 2020)’에 따라 수행하였다. 조사대상지는 각 지역별 3개 지점을 3반복으로 조사하는 것을 원칙으로 하였으나, 측정넷 장비가 옥상이나 건물 또는 타워에 설치된 장소(관악, 홍릉, 고양, 대전, 인천 서구)는 각 1개의 지점이 제외되었다. 용인지역은 1개의 지점에 장비 3대가 설치되어 있어 수목조사 또한 1개 지점에 대해서만 수행하였다. 수목조사 대상지는 산림미세먼지측정넷이 설치된 곳의 환경 및 여건을 반영하여 선정하다 보니, 조사 면적은 달랐다. 항목 중 수종(Species), 흉고직경(DBH), 수목 주소(Tree address), 토지이용(Land Use), 지층/면적(Strata/Area), 가로수여부(Street tree/non-street tree), 수고(Total tree height), 수관높이(Crown Height to live top), 수관기저고(Crown Height to crown base), 수관폭(Crown width), 수관손실률(Percent crown missing), User Tree ID를 수목 정보로 입력했다.

Table 1. Pre-setting lists before using i-Tree Eco Program.
Minimum Requirements General Site Fields Tree Detail Fields Management Fields
Species Tree address Total tree height User Tree ID
DBH Land Use Crown size
Strata/Area
  • Height to live top

Street tree/non-street tree
  • Height to crown base

  • Crown width

  • Percent crown missing

Download Excel Table
3. 한국형 i-Tree Eco를 활용한 도시숲의 가치평가

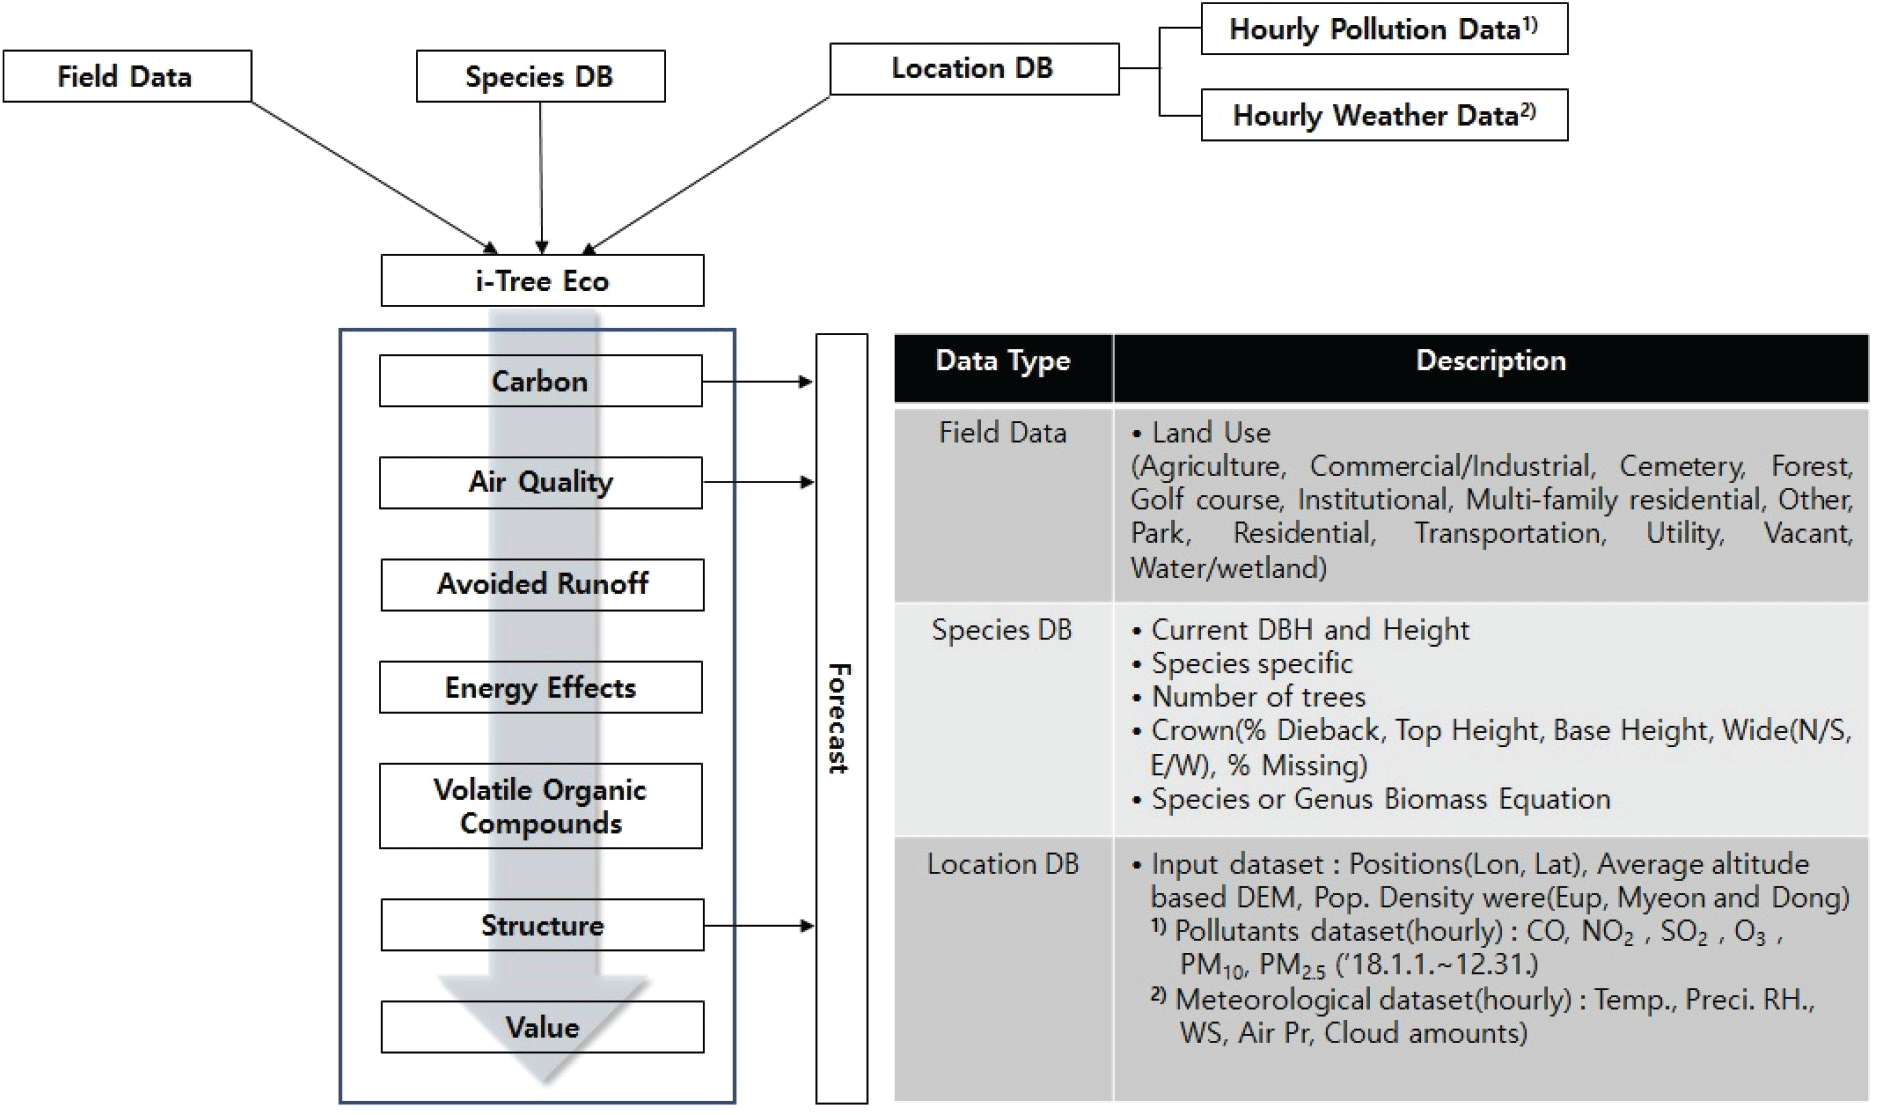
i-Tree Eco는 미국 산림청(U.S.D.)과 Davy Institute가 개발한 i-Tree 프로그램 도구 중 하나로, 국립산림과학원은 국제공동연구를 통해 국내 수목, 도시숲, 산림 등의 녹지를 평가할 수 있도록 수종정보, 위치정보, 대기오염물질, 기상정보, 오존, 알베도값 등의 국내 데이터를 i-Tree Eco 프로그램에 반영하였다. 이러한 한국형 i-Tree 프로그램은 특·광역시 단위 뿐만아니라, 시·군·동·면 또는 어느 특정 녹지면적에 대해 그 가치를 평가할 수 있게 되었다. 대기오염 및 기상 정보는 2018년 데이터를 활용하여 평가하였다. 한국형 i-Tree 프로그램 평가를 위한 과정은 Figure 2와 같으며, i-Tree Eco에서 서비스 항목별 산출값을 얻기 위해 조사해야 하는 항목(즉, 측정값을 입력해야 값을 얻을 수 있음)을 버전 6.0 기준으로 정리하였다(Table 2).
jksfs-114-1-1-g2
Figure 2. Input variables, procedure in each Data type, and output variables from i-Tree Eco.
Download Original Figure
Table 2. Use of Direct Measure by i-Tree Eco(v6.0)(itreetools.org).
Derived Variables Ecosystem Services
Direct Measures Leaf Area Leaf Biomass Carbon Storage Gross Carbon Sequestration Net Carbon Sequestration Energy Effects Air Pollution Removal Avoided Runoff Transpiration VOC Emissions Compensatory Value Wildlife Suitability UV Effects
Species D D D D D D I I I D D
Diameter at breast height (DBH) D D D D D
Total height D D D D D D I I I I D
Crown base height D D C I I I I
Crown width D D C I I I I
Crown light exposure (CLE) D D
Percent crown missing D D C D I I I I
Crown health (condition/dieback) D D D D
Field land use D D D D D
Distance to building D
Direction to building D
Percent tree cover D D D D D
Percent shrub cover D
Percent building cover D
Ground cover composition D
Maintained Grass, Unmaintained Grass, and Herbaceous % cover I

D Directly used I Indirectly used C Conditionaly used

Download Excel Table

본 연구에서는 각 지역별 그린 인프라의 대기오염물질 제거(Air Pollutants Removal), 탄소 저장 및 흡수(Carbon Storage and Sequestration), 산소 생산(Oxygen Production), 유수 유출 방지(Avoided Runoff), 구조자산가치(Replacement Values)를 산출했다. 각 항목의 정량적인 수치와 경제적 가치를 산출하는 방법은 다음과 같다.

1) 대기오염물질 저감량

대기오염물질은 오존(O3), 이산화황(SO2), 이산화질소(NO2), 일산화탄소(CO), PM10, PM2.5로 구성된다. 해당 항목의 추정치는 큰 잎(big-leaf)과 다층 캐노피 침강 모델(multi-layer canopy deposition models)를 하이브리드한 방법을 기반으로 오존과 황 및 이산화질소의 시간당 수관층 저항(tree-canopy resistance)으로부터 도출된다(Baldocchi, 1988; Baldocchi et al., 1987). 식물에 의한 일산화탄소와 미세먼지의 제거는 증산과 직접적인 관련이 없기에, 오염 물질의 제거율(removal rates)은 잎 생물계절학(leaf phenology)과 잎 면적에 따라 조정된 평균 측정 값을 기반으로 추정된다(Bidwell and Fraser, 1972).

대기오염물질 제거의 경제적 가치 추정은 사용자의 거주 국가 오염 값(user-defined local pollution values)을 사용한다. 지역 값(local values)가 없는 경우 European median externality values(Van Essen et al., 2011)이나 BenMap regression equations을 기반(Nowak et al., 2024)으로 추정한다. 이후 해당 국가의 환율에 맞추어 경제적 가치로 환산된다.

대기오염물질저감량(F, g/m2/s)은 대기 중 오염물질 농도(C, g/m3)와 오염물질 침강속도(Vd, m/s)를 활용하여 다음과 같은 식으로 계산된다.

F = C × V d

오염물질 침강속도(Vd) : Vd=1Ra+Rb+Rc

Ra = 공기역학적 저항, Rb = 준층류경계층 저항,

Rc = 수관층 저항(대기오염물질별로 상이)

공기역학적 저항(Ra)과 준층류 경계층 저항(Rb)은 표준 저항 수식(Killus et al., 1984; Nowak et al., 1998; Pederson et al., 1995)과 시간당 기상 데이터를 기반으로 추정된다. 수관층 저항(Rc)은 대기오염물질별로 상이하며, NO2, SO2, O3에 대한 Rc는 수목 부위별 대기오염물질에 대한 저항값(rs, rm, rt)을 기반으로 다음과 같이 산출된다(Baldocchi et al., 1987; Baldocchi, 1988).

1 R c = 1 r s + r m + 1 r t

rs= 기공저항, rm= 엽육저항, rt= 큐티클저항

엽육저항(rm, s/m)은 SO2에 대해 0으로(Wesely, 1989), O3에 대해 10으로(Hosker and Lindberg, 1982), 그리고 NO2에 대해 100으로 적용된다(Lovett, 1994). 큐티클저항(rt, s/m)은 SO2, O3, NO2에 대해 각각 8,000, 10,000, 20,000으로 적용된다(Lovett, 1994). 기공저항(rs)은 시간당 광합성유효복사(photosynthetically active radiation, PAR, μE/m2/s), 기온(K°), 풍속(m/s), 마찰속도(u*, m/s), CO2 농도(390 ppm), 절대 습도(kg/m3)를 활용하여 산출된다.

식물에 의한 일산화탄소와 미세먼지(PM10, PM2.5) 저감은 증산과 직접적인 관련이 없으므로 오염 물질의 제거율(removal rates)은 잎 생물계절학(leaf phenology)과 잎 면적에 따라 조정된 평균 측정 값을 기반으로 추정된다(Bidwell and Fraser, 1972). 즉, RcVd값을 다수의 선행연구를 참고하여 상수로 설정하였다. 일산화탄소에 대한 Rc(s/m)는 잎의 유무에 따라 각각 50,000(잎이 있는 계절), 1,000,000(잎이 없는 계절)를 적용하며(Bidwell and Fraser, 1972), PM10에 대한 침강속도(Vd, m/s)는 기본적으로 대기 중 재부유율(resuspension percentage) 50% 기준으로 0.064로 설정하였으나, 잎의 유무에 따라 조정된다(Zinke, 1967). PM2.5에 대한 침강속도 및 재부유율은 Nowak (2013)를 참고하여 풍속에 따라 다르게 적용하였다(Table 3).

Table 3. Deposition velocities and percent resuspension by wind speed for PM2.5.
Wind Speed (m/s) Average Deposition Velocity (Vd, cm/s) Resuspension (%)
0 0.00 0.0
1 0.03 1.5
2 0.09 3.0
3 0.15 4.5
4 0.17 6.0
5 0.19 7.5
6 0.20 9.0
7 0.56 10.0
8 0.92 11.0
9 0.92 12.0
10 2.11 13.0
11 2.11 16.0
12 2.11 20.0
13 2.11 23.0
Download Excel Table

대기오염물질 제거의 경제적 가치 추정은 사용자의 거주 국가 오염 값(user-defined local pollution values)을 사용한다. 지역 값(local values)가 없는 경우 European median externality values(Van Essen et al., 2011)이나 BenMap regression equations을 기반(Nowak et al., 2024)으로 추정한다. 이후 해당 국가의 환율에 맞추어 경제적 가치로 환산된다.

2) 탄소 저장 및 흡수량

탄소 저장은 산림 및 도시숲을 이루는 수목의 지상 및 지하 부분에 저장된 탄소의 양으로, 이를계산하기 위해 각 수목의 탄소 방정식과 측정값을 사용하여 바이오매스를 계산한다. 개방된 곳에서 자라는 수목은 산림 수종의바이오매스식(forest-derived biomass equations)에 의해 예측된 값보다 적은 경향이 있기때문에(Nowak, 1994), 추정값에 0.8을 곱한다. 개방형 수목은 다른 나무와 공간이나 자원을 두고 경쟁하지 않는환경에서 자란 나무를 의미하며, 주로 공원, 주택 정원 또는 거리와 같은 개방된 공간에서 자란다. 탄소 흡수는 식물에 의해대기 중에서 제거된 이산화탄소를 의미한다. 연간 탄소 흡수량을 추정하기 위해 기존의 나무 직경(year x)에 적절한속(genera) 및 경급(diameter class)과 나무 상태(tree condition)를 추가하여 다음 연도(year x+1)의 수목 직경 및 탄소 저장량을 추정한다.

탄소 저장 및 흡수량의 경제적 가치는 추정값 또는 각 해당국가의 탄소 값을 기반으로 계산된다. 지역 값이 없는 경우, 미국의 탄소 값(U.S. Environmental Protection Agency 2015, Interagency Working Group on Social Cost of Carbon 2015)을 기반으로 해당 국가 환율에 맞추어 환산한다.

i-Tree Eco 프로그램에서는 수목의 필수입력자료(수종, 흉고직경)를 기반으로 구한 총 건중량에 전환계수 0.5를 곱하여 수목의 탄소저장량(㎏)을 추정한다(Chow and Rolfe, 1989).

탄소저장량  =  총 건중량  × 0.5

연간 탄소흡수량은 1년간 수목이 흡수하는 탄소량(kg/yr)을 의미한다.

연간 탄소흡수량 = 다음 연도의 탄소저장량(1년) 현재 연도의 탄소저장량 0
3) 산소 생산

산소 생산량은 원자량과 탄소 흡수량을 기반으로 추정한다(Nowak et al., 2007d).

순산소생산량  ( k g / y r ) =  순탄소흡수량  ( k g / y r ) × 32 12

(Nowak et al., 2007d)

순탄소흡수율(Net carbon sequestration rate)를 추정하기 위해, 수목 성장의 결과로 흡수된 탄소의 양(the amount of carbon sequestered)은 수목 고사로 인한 손실량만큼 감소한다.

4) 유수 유출 방지

연간 유수 유출 방지량은 식생에 의한 강우 차단(rainfall interception), 특히 식생이 있을 때의 연간 유출량과 없을 때의 유출량 간의 차이를 기준으로 계산한다. 주로 수목의 잎, 가지, 껍질이 강수를 차단시켜 표면 유출을 완화 시키는데, i-Tree에서는 잎에 의한 차단량만을 계산한다.

지역 값이 없는 국가의 경우 미국의 국가 평균값을 기반으로 해당 국가 환율에 맞추어 환산한다(McPherson et al., 1999; 2000; 2001; 2002; 2003; 2004; 2006a; 2006b; 2006c; 2007; 2010).

5) 구조자산가치(Replacement Values)

구조자산가치(Replacement Values)는 분석 대상지의 수목을 유사한 수목으로 교체할 때 드는 비용으로, 수종(Tree Species), 직경, 상태(condition), 지역 정보(location information)를 고려하는 CTLA(the Council of Tree and Landscape Appraisers)의 평가 절차를 기반으로 계산한다(Nowak et al., 2002a; 2002b).

4. 국내 도심 녹지 CO2 흡수량 산정

국내 도시 수목의 이산화탄소 흡수량을 계산하는 상대생장식은 다음과 같다(Lee, 2003). 이산화탄소 흡수량은 수목의 연간 평균 직경생장률로 침엽교목 0.64 cm(Jo, 1999; Son et al., 1997; Park, 1987; Jeong et al., 1985), 활엽교목 0.67 cm(Jo, 1999; Son et al., 1997; Jeong et al., 1985)를 사용하여 그 변화량을 흉고직경의 함수로 다시 표현한 것이다.

CO 2  AB  ( kg/yr ) = Population of Broadleaf tree  × BT 1 + Population of Needleleaf tree  × BT 2 + Population of Broadleaf shrub  × BS 1 + Population of Needleleaf shrub  × BS 2

BT1 : Y = −4.2136 + 1.9006 DBHaver. - 0.0068 DBHaver.2

BT2 : Y = −2.7714 + 0.9714 DBHaver. - 0.0225 DBHaver.2

BS1 : ln Y = −3.4025 + 1.5823 lnDBHaver.

BS2 : ln Y = −2.8689 + 1.3350 lnDBHaver.

결과 및 고찰

1. 조사대상지의 수목조사 결과

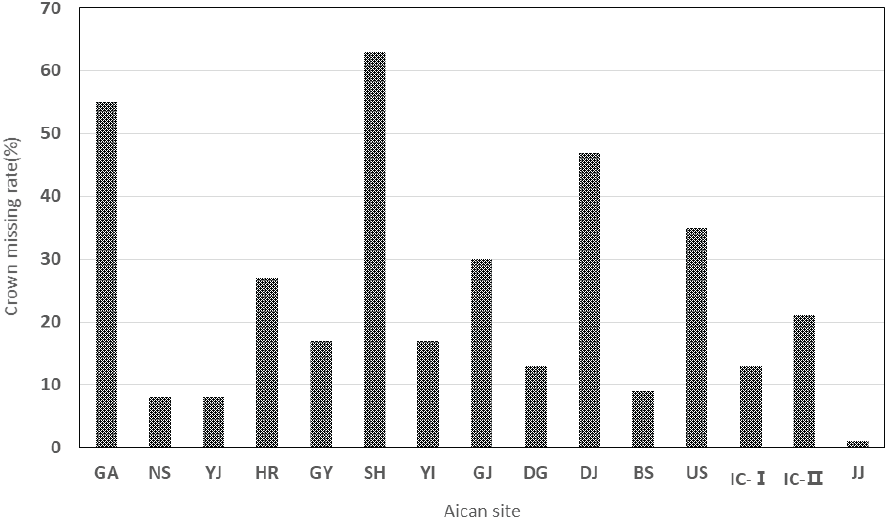
전국 특·광역시, 지자체 중 산림미세먼지측정넷 지점주변의 15개 사이트 38개 지점을 조사한 결과, 총 면적 1.74 ha, 총 수목 개체수는 2,057본으로 침엽수 982본, 활엽수 1,075본을 조사하였다(Table 4). 각 지역마다 다양한 토지형태, 오염원, 수종 등이 조사되었다. 토지유형은 IPCC(%) 기준 산림지 9개 지역, 초지 5개 지역, 초지 및 기타 1개 지역으로 조사되었다. i-Tree에서 구분하고 있는 지표(land cover, %)유형 기준으로는 낙엽층 5개 지역, 낙엽층 및 바위 1개 지역, 초지 4개 지역, 관리되지 않는 초지 3개 지역, 아스팔트 및 잔디 1개지역, 잔디 1개 지역으로 조사되었다. 대상지의 지점 중 면적내 수종을 전수 조사하였고, 각 지점별 조사된 수종 중 우점종에 대한 수종명, 평균 수고(m), 평균 흉고직경(cm), 수관폭, 수관 손실율에 대해 조사하였다(Table 4). 100본 이상 조사된 지역의 우점종 특성은 관악산(GA)은 리기다소나무(Pinus rigida)가 우점하고 있었으나, 수관에 대한 손실율이 55% 정도로 수목의 건강관리가 필요한 상태였다. 남산(NS)은 교목은 소나무(Pinus densiflora), 아교목층은 당단풍나무(Acer pseudosieboldianum)가 우세하고 있었다. 시흥(SH)은 차단숲의 경우 곰솔이 많이 식재되어 있었으나 수관손실율이 63%로 다른 지역에 비해 높게 조사되었다. 부산(BS) 완충숲의 경우 비목나무(Lindera erythrocarpa)와 소나무가 우점하고 있었으며 손실율(각각 9%, 1%)이 적게 조사되었다. 울산(US)숲은 소나무(Pinus densiflora)가 우점하고 있었으며 수관 손실율은 35%정도로 조사되었다. 평균 흉고직경(DBH)이 30 cm이상의 수종이 분포하는 지역은 홍릉(HR), 대구(DG), 부산(BS), 10 cm이하가 조사된 지역은 관악(GA), 대구(DG), 부산(BS), 인천서구(IC-Ⅰ)로 파악되었다. 관악(GA)의 경우 조사면적내 개체수는 많으나 흉고직경과 수고가 낮은 수종이 많이 분포되어, 밀도가 높은 구조를 가지고 있었다.

Table 4. Information of Survey site and Species by AiCAN’s green infrastructure.
Site Total Number of Species Dominant Species Information
ID* Land use Pollution Sources area(ha) Coniferous Trees Deciduous Trees Total Scientific name # trees Avg. HT (m) Avg. DBH (cm) CB(m) Crown missing rate (%)
IPCC(%) i-Tree land cover(%) Total Point
GA(Gwanak) Forest land (100) Duff/mulch(90), rock(10) Commercial/residentioal 0.16 0.04 36 0 36 Chamaecyparis pisifera 25 3.9±0.8 6.0±1.5 0.7±0.2 0
0.12 212 94 306 Pinus rigida 100 6.9±3.0 13.0±5.4 4.7±2.4 55±27
NS(Namsan) Forest land (100) Duff/mulch (100) Commercial/residentioal 0.27 0.12 1 150 151 Acer pseudosieboldianum 57 5.1±1.8 5.2±2.3 2.3±0.8 8±12
0.12 73 6 79 Pinus densiflora 73 10.0±2.9 21.6±7.1 6.0±1.9 23±20
0.03 17 2 19 Pinus densiflora 17 7.6±2.6 24.8±6.0 4.4±1.7 35±33
YJ(Yangjae) Forest land (100) Grass (100) Commercial/residentioal 0.09 0.03 8 16 24 Zelkova serrata 12 12.9±1.7 20.6±6.3 6.5±3.1 13±11
0.03 15 8 23 Pinus koraiensis 7 15.0±1.4 28.1±8.7 4.4±1.2 16±20
0.03 9 16 25 Zelkova serrata 8 15.7±1.4 27.7±15.9 6.7±3.7 8±4
HR(Hongreung) Forest land (100) Unmain grass (100) Commercial/residentioal/beltway 0.13 0.12 51 19 70 Pinus densiflora 30 12.4±3.7 35.3±11.0 8.0±3.6 27±20
0.01 13 0 13 Pinus densiflora 13 10.6±2.6 23.7±2.8 2.9±1.4 4±7
GY(Goyang) Forest land (100) Duff/mulch (100) LNG 0.06 0.03 15 17 32 Pinus rigida 14 16.2±2.4 28.4±6.3 10.5±2.3 17±9
0.03 24 6 30 Pinus densiflora 12 9.8±1.7 28.0±3.3 3.2±1.0 0±0
SH(Siheung) Grass land (100) Unmain grass (100) Industrial complex 0.09 0.03 11 7 18 Pinus densiflora 7 5.7±0.8 25.3±4.6 2.4±0.3 6±5
0.03 25 0 25 Pinus rigida 21 10.8±2.4 23.3±5.0 4.3±1.4 20±10
0.03 106 21 127 Pinus thunbergii 106 10.6±1.5 21.1±4.0 6.6±1.7 63±18
YI(Yongin) Forest land (100) Grass (100) Highway 0.12 0.12 0 74 74 Liriodendron tulipifera 72 17.7±5.2 25.3±10 8.2±3.5 17±16
GJ(Gwangju) Grass land (100) Grass (100) Industrial complex 0.09 0.03 6 17 23 Quercus acutissima 6 16.5±5.0 23.4±10.1 5.6±1.9 2±4
0.03 6 21 27 Pinus strobus 6 10.2±0.3 21.8±2.9 2.7±0.4 30±13
0.03 11 17 28 Quercus acutissima 7 14.0±0.6 29.4±4.2 9.5±2.1 23±10
DG(Daegu) Forest land (100) Duff/mulch (100) Industrial complex 0.09 0.03 29 43 72 Quercus variabilis 28 4.8±2.2 5.2±7.5 2.6±0.7 13±18
0.03 13 0 13 Pinus densiflora 13 16.3±2.4 34.3±3.8 7.2±1.8 4±5
0.03 18 8 26 Pinus densiflora 14 8.7±2.5 19.1±5.6 3.8±0.7 1±4
DJ(Daejeon) Grass, other Tar(아스팔트) Herbs(잔디) Commercial/residentioal 0.06 0.03 11 9 20 Quercus palustris 5 10.3±1.0 22.9±4.3 2.8±0.7 8±8
0.03 17 16 33 Pinus strobus 10 12.7±2.3 21±3.7 4.0±0.8 47±14
BS(Busan) Forest land (100) Duff/mulch (100) Industrial complex 0.18 0.12 38 106 144 Lindera erythrocarpa 36 4.4±1.6 3.8±2.7 2.4±1.6 9±15
0.03 8 10 18 Pinus densiflora 8 11.6±1.7 33.3±15.3 6.3±1.3 1±4
0.03 1 33 34 Lagerstroemia indica 16 3.8±1.1 4.4±1.4 1.8±0.4 11±12
US(Ulsan) Forest land (100) Duff/mulch (100) Industrial complex 0.18 0.12 65 178 243 Pinus densiflora 62 12.8±3.5 28.4±7.4 7.8±1.7 35±15
Quercus variabilis 62 5.7±2.5 4.2±1.5 3.3±0.9 11±10
0.03 5 35 40 Celtis sinensis 9 10.5±3.3 13.8±3 6.4±3.0 6±10
0.03 8 51 59 Prunus serrulata 46 7.5±1.6 10.1±3.7 2.2±0.8 11±14
IC-I(Incheon Seo-gu) Grass land (100) Grass (100) Industrial complex 0.06 0.03 28 8 36 Pinus strobus 15 10±1.5 16.1±4.4 3.2±1.3 13±8
0.03 9 20 29 Quercus palustris 7 5.3±0.8 7.7±1.0 1.9±0.1 0±0
IC-II(Incheon Songdo) Grass land (100) Unmain grass (100) Commercial/residentioal 0.07 0.03 20 12 32 Pinus thunbergii 19 10.6±1.1 17.7±2.8 4.2±1.1 14±11
0.03 33 6 39 Pinus thunbergii 32 8.2±1.6 11.4±2.4 2.3±0.9 21±14
0.01 9 0 9 Pinus thunbergii 9 6.7±2.9 17.5±4.6 1.9±0.5 1±3
JJ(Jeonju) Grass land (100) Herb (100) Commercial/residentioal 0.09 0.03 24 10 34 Pinus densiflora 20 10.4±2.6 19.5±6.8 5.7±2.4 1±3
0.03 6 20 26 Styrax japonicus 7 3.1±0.6 4.5±1.0 1.1±0.3 70±34
0.03 1 19 20 Quercus palustris 5 15.1±1.8 30.4±9.2 4.4±0.8 18±8

The 15 AiCANs are all non-street tree. HT is the total tree height and CB is the Crown Base Height.

IPCC GPG LULUCF(%) land use types : Forest land, Cropland, Grassland, Wetlands, Settlements, Other land, Remarks

i-Tree Land cover(% land use types : Bare soil, Building, Cement, Tar, Rock, Duff/mulch, Grass, Unmain grass, Herbs, Other impervious, Water

Download Excel Table
2. i-Tree Eco 분석 결과

i-Tree Eco는 수목의 종과 구성, 잎면적과 수목의 건강성 등의 인자를 사용하여 도시숲이나 나무가 제공하는 생태서비스를 평가할 수 있는 프로그램 이다. 산림미세먼지측정넷 15개소의 수목 정보를 바탕으로 i-Tree Eco 분석을 수행하여 각 개소의 중요 수종의 빈도율(%), 엽면적율(%), 중요치에 대한 분석과 조사된 전체 개체의 엽면적(ha)을 분석 하였다(Table 5). 또한, 각 개소의 대기오염물질 제거, 탄소 저장 및 흡수, 산소 생산량, 유수 유출 방지량, 구조자산가치와 이들의 경제적 가치를 구한 뒤 지역별 수목 조사 면적을 나누어 단위 면적당 결과를 도출했다(Table 6).

Table 5. Total Leaf area(ha) and Most important species in AiCAN’s green infrastructure by i-Tree Eco.
Site ID Most importance species Total Leaf Area(ha)**
Scientific name Percent Population(%) Percent Leaf Area(%) IV*
GA(Gwanak) Pinus rigida 28.1 15.9 44.0 0.5089
NS(Namsan) Pinus densiflora 36.1 32.0 68.1 1.1120
YJ(Yangjae) Zelkova serrata 27.8 21.8 49.6 0.9391
HR(Hongreung) Pinus densiflora 51.8 74.6 126.4 0.5446
GY(Goyang) Pinus rigida 22.6 24.7 47.2 1.0600
SH(Siheung) Pinus thunbergii 62.4 40.4 102.8 0.6547
YI(Yongin) Liriodendron tulipifera 97.3 99.9 197.2 1.0030
GJ(Gwangju) Quercus acutissima 16.7 27.0 43.7 1.2410
DG(Daegu) Pinus densiflora 45.0 77.4 122.5 0.7984
DJ(Daejeon) Pinus strobus 28.3 30.3 58.6 0.5983
BS(Busan) Pinus densiflora 15.8 17.2 33.0 1.6330
US(Ulsan) Pinus densiflora 19.7 55.2 74.9 2.4880
IC-I(Incheon Seo-gu) Pinus thunbergii 20.0 47.3 67.3 0.4022
IC-II(Incheon Songdo) Pinus thunbergii 75.0 58.5 133.5 0.5877
JJ(Jeonju) Pinus densiflora 32.1 38.4 70.5 0.7676

IV(Importnace Values) : Importance values (IV) are calculated as the sum of percent population and percent leaf area. High importance values do not mean that these trees should necessarily be encouraged in the future; rather these species currently dominate the urban forest structure.

Leaf Area(ha) is leaf surface area of the trees on each sites.

Download Excel Table
Table 6. Analysis results of 15 AiCAN’s green infrastructure using i-Tree Eco per area.
Site Pollution Removal Carbon Storage Carbon Sequestration Oxygen Production Avoided Runoff Replacement values
PR (kg/yr/ha) MV (\/yr/ha) Cstr (t/ha) MV (\/ha) Cseq (t/yr/ha) MV (\/yr/ha) OP (t/yr/ha) AR (m3/yr/ha) MV (\/yr/ha) RV (\/ha)
GA 92.88 15,937,500 71.50 16,312,500 5.69 1,300,000 15.16 149.88 421,875 279,375,000
NS 86.04 3,422,222 94.30 21,518,519 3.46 788,889 9.22 160.30 451,852 187,407,407
YJ 140.89 7,255,556 131.78 30,111,111 4.76 1,085,556 12.69 254.78 716,667 337,777,778
HR 104.08 17,307,692 85.23 19,461,538 3.82 869,231 10.19 170.92 480,769 288,461,538
GY 418.00 71,333,333 117.85 26,833,333 6.28 1,433,333 16.75 700.50 1,966,667 608,333,333
SH 291.00 13,222,222 210.22 48,000,000 12.59 2,866,667 33.56 367.56 1,034,444 803,333,333
YI 91.75 1,791,667 103.42 23,583,333 5.77 1,316,667 15.40 155.33 437,500 257,500,000
GJ 205.22 43,111,111 96.44 22,000,000 5.99 1,366,667 15.97 403.89 1,133,333 601,111,111
DG 234.00 11,444,444 71.07 16,222,222 4.19 955,556 11.17 396.33 1,111,111 500,000,000
DJ 242.67 24,500,000 96.08 22,000,000 5.45 1,245,000 14.54 342.33 963,333 695,000,000
BS 232.67 4,033,333 107.50 24,500,000 6.18 1,411,111 16.48 444.11 1,250,000 700,000,000
US 504.61 2,933,333 101.06 23,055,556 7.25 1,655,556 19.33 783.33 2,205,556 441,111,111
IC-I 176.83 18,666,667 72.03 16,433,333 4.79 1,093,333 12.77 257.50 725,000 211,666,667
IC-II 246.00 6,185,714 73.06 16,714,286 6.38 1,457,143 17.00 316.14 890,000 434,285,714
JJ 183.89 18,333,333 73.84 16,888,889 4.06 926,667 10.84 281.22 791,111 576,666,667
Total 3,250.53 259,478,127 1,505.38 343,634,620 86.66 19,771,376 231.07 5,184.12 14,579,218 6,922,029,659

GA(Gwanak), NS(Namsan), YJ(Yangjae), HR(Hongreung), GY(Goyang), SH(Siheung), YI(Yongin), GJ(Gwangju), DG(Daegu), DJ(Daejeon), BS(Busan), US(Ulsan), IC-I(Incheon Seo-gu), IC-II(Incheon Songdo), JJ(Jeonju)

Download Excel Table

15개 지역 중 엽면적이 가장 높게 조사된 지역은 울산(US, 2.488 ha)으로, 인천 서구(IC-Ⅰ, 0.4022)로 가장 낮게 분석되었다. 대기오염물질은 시민의 건강 뿐만 아니라 생태계의 건강에도 영향을 끼친다(Tzoulas et al., 2007). 나무는 매년 다량의 입자상 물질, 질소산화물, 황화물을 흡수하고 여과할 수 있다(Nowak et al., 2006a; Nowak, 2002c). i-Tree는 나무가 정화한 공기 중 다양한 오염물질의 총량을 정량화하고 추정할 수 있다(Hirabayashi et al., 2012). 15개소의 대기오염물질 제거량을 분석 결과 울산(US)이 연간 약 504.6 kg/ha로 15개 지역 중 가장 많이 제거하였고, 다음으로 고양(GY, 418 kg/ha), 시흥(SH, 291 kg/ha)순으로 높게 분석되었다. 경제적 가치는 고양(GY)이 71,333,333원으로 가장 높게 산정되었고, 다음으로는 광주(GJ, 43,111,111원)로 분석되었다. 대기오염물질은 오염원이 산업단지, LNG 등 오염물질을 많이 발생하는 지역이 저감량과 경제적 가치가 높게 환산이 되었다.

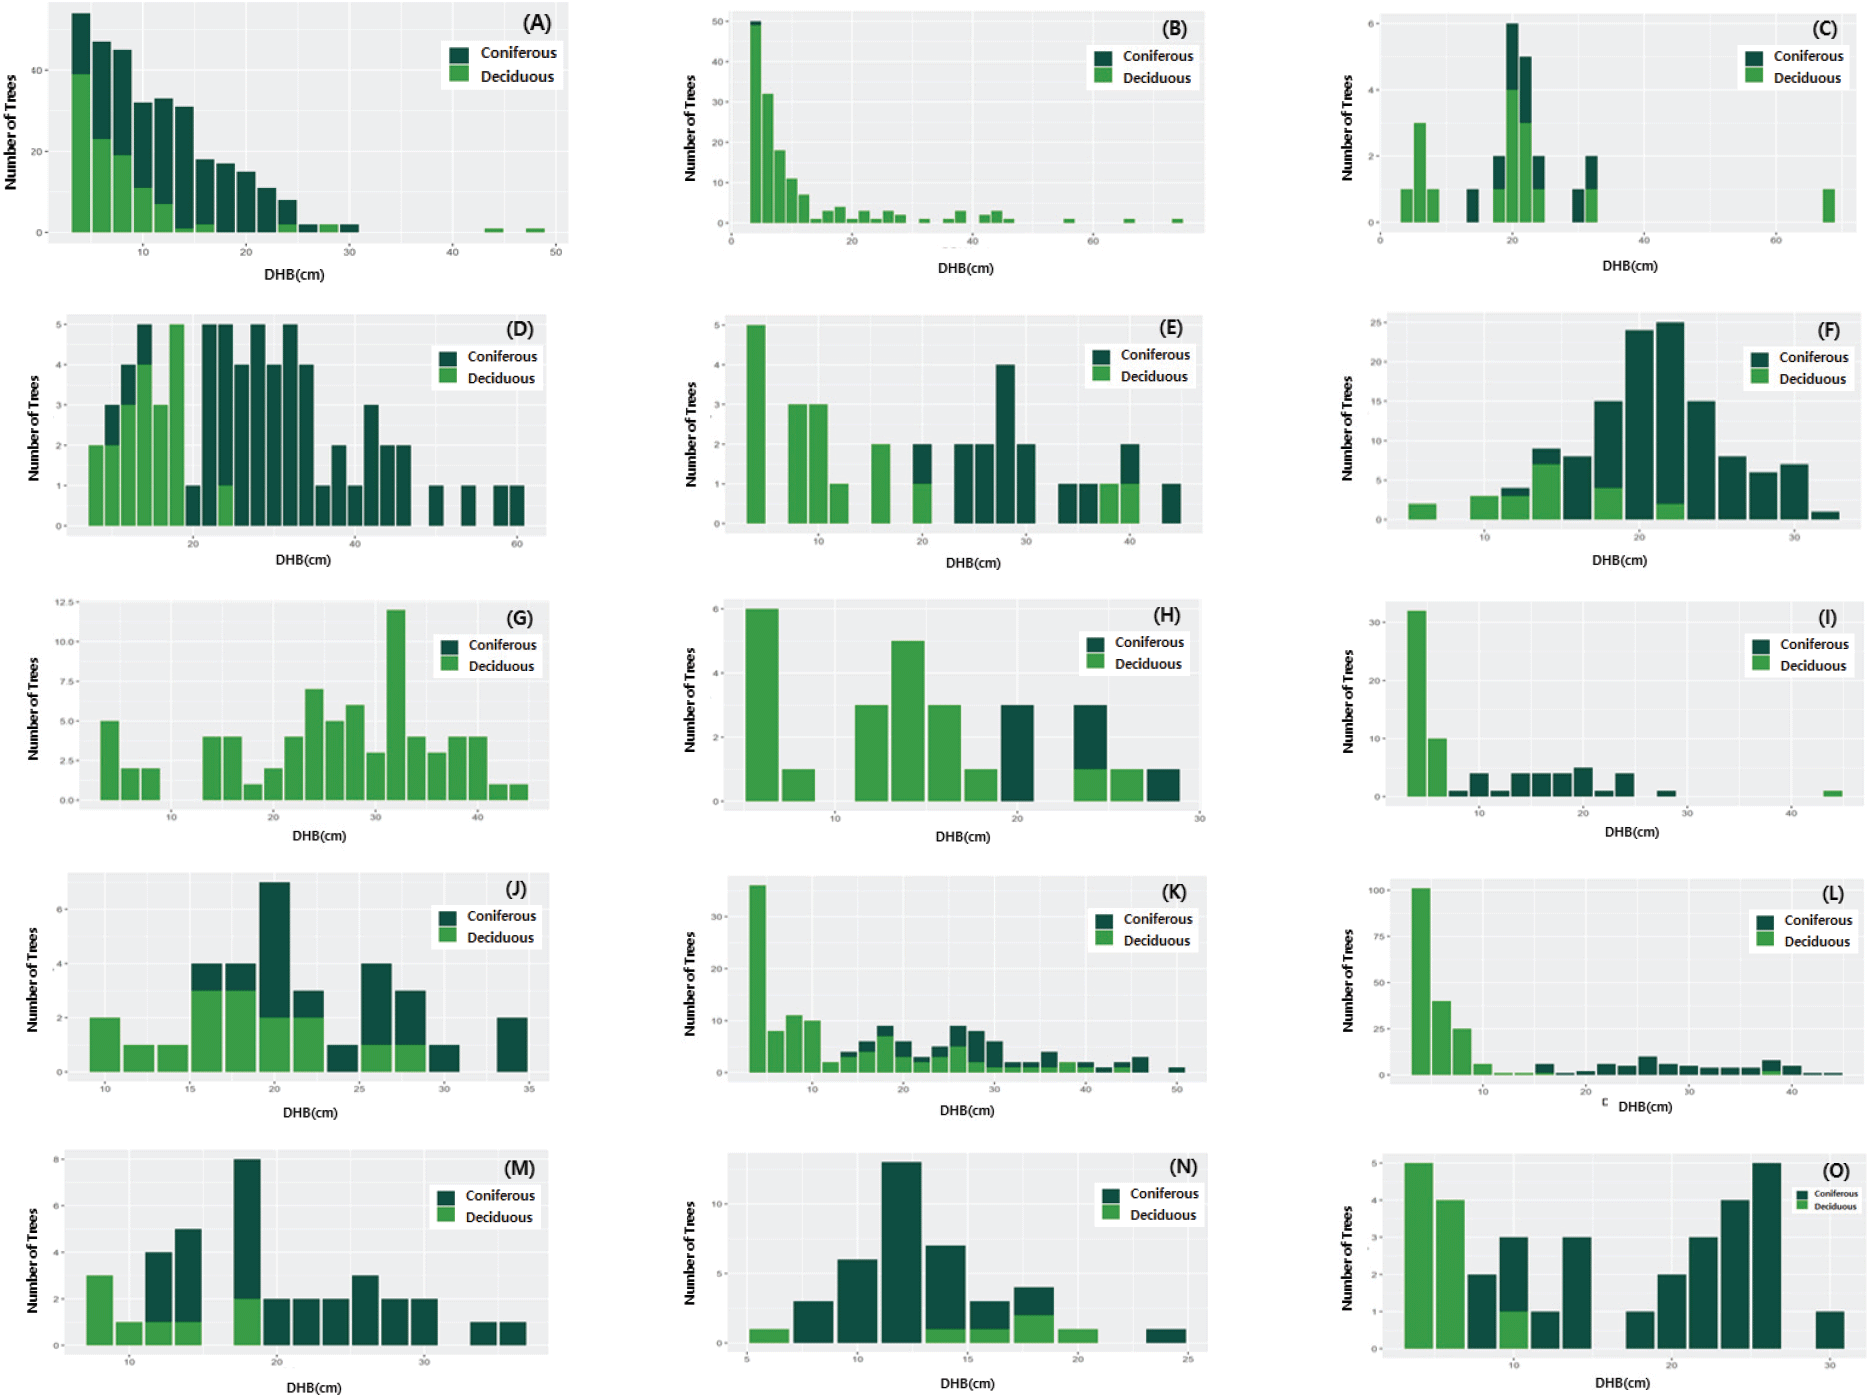
무기물을 유기물로 전환하고 산소를 방출하는 광합성과정에서 공기 중 이산화탄소가 감소할 뿐만 아니라 산소도 생성되어 공기 중 탄소와 산소의 균형을 유지한다. 연간 탄소 흡수 능력을 보여주는 연간 탄소흡수량은 나무 크기, 건강 상태, 수관면적 및 공간 분포와 관련된 i-Tree Eco로 계산할 수 있다(Song et al., 2020). 15개소의 탄소 저장량과 흡수량을 평가한 결과, 탄소 저장량(210.22 t/ha)과 흡수량(12.59 t/년/ha), 그리고 이의 경제적 가치(48,000,000원, 2,866,667원), 산소 생산량(33.56 t/년/ha)과 구조자산가치(803,333,333 원/ha)에서 시흥(SH)이 가장 높게 평가되었다. 같은 수종에 있어서 직경이 큰 나무들은 숲의 구조 및 기능에 큰 영향을 미친다(Lutz et al., 2013). 시흥(SH)은 수관손실율(63%)은 높았으나, 개체수가 많이 조사된 상록침엽수인 곰솔(흉고직경 20 cm 이상, 수고가 10 m 이상)이 다른 개소에 비해 규격이 큰 영향으로 판단된다(Figure 3). 미국의 여러 도시에 식재된 나무에 의한 총 탄소흡수량를 평가한 Nowak et al.의 연구에 따르면 워싱턴 DC, 캐스퍼, 샌프란시스코, 필라델피아, 뉴욕의 나무에 의한 총 흡수량은 약 16,200톤(Nowak et al., 2006a), 1200톤(Nowak et al., 2006c), 5200톤(Nowak et al., 2007a), 16,100톤(Nowak et al., 2007b), 42,300톤(Nowak et al., 2007c)으로 평가되었다.

jksfs-114-1-1-g3
Figure 3. Crown missing rate(%) of trees in each survey area.
Download Original Figure

전세계적으로 도시홍수는 빈번하게 발생하고 있으며(Kubal et al., 2009; Yin et al., 2015), 도시에서 나무가 유수 유출을 감소시키는 역할을 한다는 많은 연구가 보고되었다(Wang et al., 2008; Armson et al., 2013; Zhang et al., 2015). 15개소의 유수 유출 방지량은 울산(US)에서 783.33 m3/년/ha(2,205,556원/년/ha) 가장 높은 값으로 산정되었다. i-Tree Eco 모델의 추정 결과는 수목의 크기(DBH, 엽면적, 수관폭)가 유수 유출 방지량을 결정하는 가장 중요한 요소이다(Sally et al., 2020). 수목조사에서 울산(US)은 관악(GA)과 조사된 수목이 개체수가 342본으로 다른 지역에 비해 가장 많이 조사되었으나, 활엽수와 침엽수가 고루게 조사되었고, 흉고직경(DBH)와 수고(HT), 수관폭(CB), 엽면적이 관악(GA)보다는 울산(US)이 더 큰 수목들이 조사된 영향으로 판단된다(Figure 4).
jksfs-114-1-1-g4
Figure 4. Number of trees by DBH(cm) distribution. (These graphs reflect only one of the three surveyed points in each site with the highest number of trees; (A) GA(Gwanak) (B) NS(Namsan) (C) YS(Yangjae) (D) HR(Hongreung) (E) GY(Goyang) (F) SH(Siheung) (G) YI(Younin) (H) GJ(Gwangju) (I) DG(Daegu) (J) DJ(Daejeon) (K)BS(Busan) (L) US(Ulsan) (M) IC-I(Incheon Seo-Gu) (N) IC-II(Incheon Songdo) (O) JJ(Jeonju))
Download Original Figure
3. i-Tree Eco 결과와 기존 산출식과 비교

도시와 산림의 나무는 자라는 환경과 관리 수준 등에 따라 차이가 있다. 특히, 도시의 나무는 생활권에 식재되어 오염원에 노출, 제한된 식재환경과 인위적인 관리 등으로 같은 수종, 같은 수령의 나무여도 산림의 수종과 크기와 생장 상태가 차이가 날 수 있다. 도시에서 개방 생장하는 조경 수목을 대상으로 개발한 수종별 계량모델(Jo and Cho, 1998; Jo, 2001; 2002; 2019; Jo and Ahn, 2001; 2012; Jo et al., 2013; 2014; 2019b; 2019c)에 대한 연구가 진행되었다.

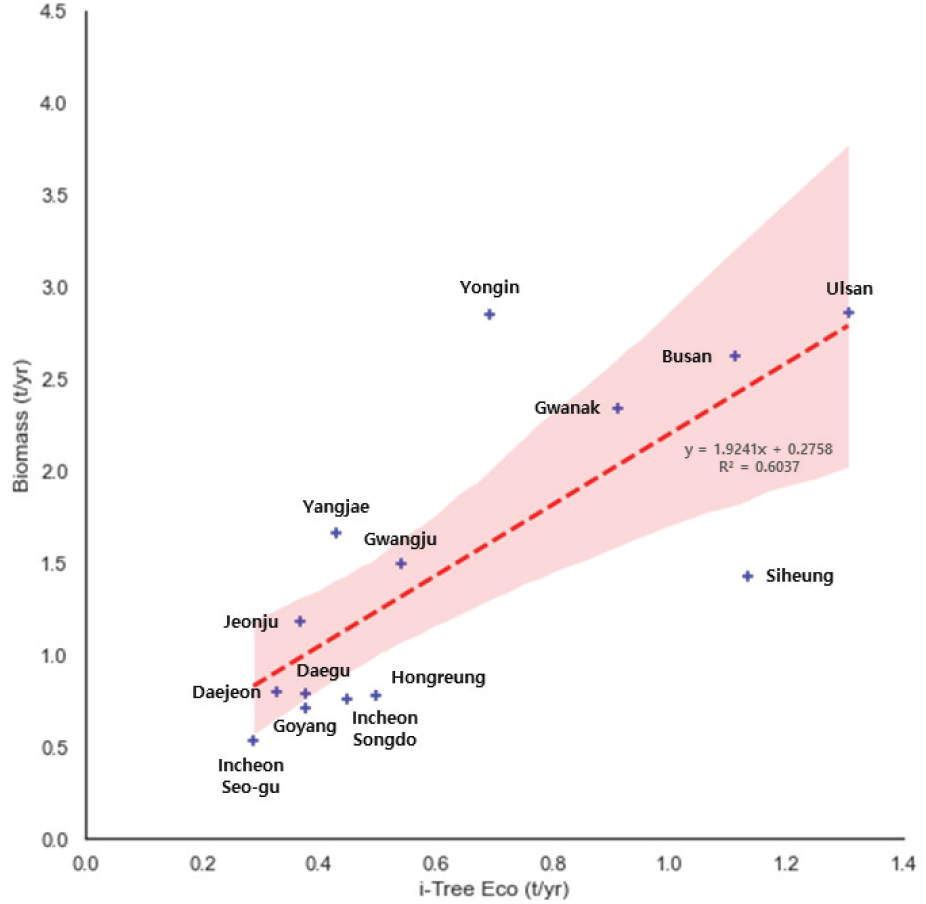
도시의 다양한 녹지(도시숲, 공원, 가로수 등)의 가치를 평가할 수 있는 (Lee, 2003)에 적용하여 i-Tree Eco 결과와 비교를 해보았다(Figure 5). 비교 과정 중 남산(NS)의 경우 수목 조사 지점 간 수고의 편차가 큰 이유로 제외하였다. 그 결과 전반적으로 유의미한 상관관계가 있다는 것을 알 수 있었다(R2 = 0.6037). 또한, 두 결과 간의 95% 신뢰구간에 관악(GW), 광주(GJ), 대구(DG), 대전(DJ), 부산(BS), 울산(US), 전주(JJ) 7개 지역이 포함되는 것을 알 수 있었다. 도시에서 생장 중인 단위면적 탄소흡수 및 저장량은 식재수량과 크기에 비례한다(Jo and Park, 2017; Jo et al., 2019a)고 보고된 바 있다. 이러한 결과는 i-Tree Eco가 국내 도심 녹지의 가치를 적절하게 평가할 수 있음을 설명하고 동시에 한국의 환경적인 특징에 적합한 i-Tree 해석 및 활용의 필요성을 시사 한다고 볼 수 있다. 하지만, 향후 효과성을 높이고 국내 도입을 위해 정확도를 높이기 위해서는 검증을 위한 연구가 지속적으로 수행되어야 할 것이다.

jksfs-114-1-1-g5
Figure 5. Result of linear regression between Lee(2003) and i-Tree Eco.
Download Original Figure

결 론

본 연구는 산림미세먼지측정넷 15개소의 수목 조사 자료를 기반으로 i-Tree Eco를 활용하여 이들의 수목 혜택(Tree Benefits)과 경제적 가치를 평가하고자 수행했다. 그 결과 시흥(SH)에서 탄소 저장량과 흡수량, 산소생산량 구조적가치가 가장 높게 나타났고, 미세먼지 저감량과 유수 유출 방지량은 울산(US)에서 가장 높은 값을 보였다. 특히, 울산(US)은 주요 조사된 소나무의 크기(흉고직경, 수고 등)가 큰 개체가 많이 조사되었고, i-Tree Eco를 통해 분석에서도 소나무의 중요도가 높고 잎면적도 약 2.49 ha로 다른 지역에 비해 가장 높게 분석되었다. 물론 측정넷 설치지점 주변의 수목을 조사한 자료를 통해 평가한 지역의 전부를 대표할 수는 없지만, 지역에 환경과 수목특성에 따라 도심 녹지의 수목 혜택(Tree Benefits)을 평가 할 수 있었다. 국내 탄소 흡수량 산정식을 활용해 동일한 수목 정보를 입력하여 계산한 결과와 i-Tree Eco의 탄소 흡수량 결과와 비교한 결과 전반적으로 좋은 상관관계를 보이는 것으로 나타났다. 그러나 더 정확한 국내 도심 녹지 평가를 위해서는 꾸준히 국내 대기오염농도 및 기상 데이터를 업데이트하고, 국내 수종 및 환경에 알맞은 수목 혜택(Tree Benefits) 산정식을 개발하여 i-Tree에 적용하고 검증하는 과정이 수행되어야 할 것이다. 본 연구는 한국형 i-Tree Eco 프로그램을 활용하여 국가 단위 또는 특·광역시, 지자체, 읍·면·동 등 큰 단위면적에서 작은 단위면적까지 대상지에 대한 환경적 및 경제적 가치를 평가하고 검증하고자 수행하였다. 본 연구는 각 도시의 측정넷지점 주변의 조사구를 선정한 수목조사결과를 평가한 것으로, 향후 도시 전체의 도시숲 면적에 대한 평가가 이루어져야 할 것이다. 또한, i-Tree Eco는 미국에서 개발된 프로그램으로 국립산림과학원과 국제공동연구 추진을 통해, 한국실정에 맞게 평가할 수 있도록 중요 인자를 개선하였다. 하지만, 포함되지 못한 홍수조절 효과 변수 등에 대한 지속적인 개선이 필요하다. 그리고, i-Tree 프로그램(Eco, Canopy, Mytree 등)의 다양한 도구(tool)를 제대로 이해하고 활용할 수 있도록 국내 사용자의 인식개선도 요구된다. i-Tree Eco는 각 국의 도시정책의 의사결정과 도시숲의 관리 과정에서 사용되고 있다(Raum et al., 2019). 따라서 국내에서도 도시숲 등의 정책적 의사결정 및 도시숲의 긍정적인 인식 개선에 활용하고, 동일한 수목에 대해 국외 사례와 비교가능한 툴로써 활용가치를 높여야 할 것이다.
References

1.

Armson, D., Stringer, P., Ennos, A.J.U.F., and Greening, U. 2013. The effect of street trees and amenity grass on urban surface water runoff in Manchester, UK. Urban Forestry & Urban Greening 12(3): 282-286

2.

Baldocchi, D. 1988. A multi-layer model for estimating sulfur dioxide deposition to a deciduous oak forest canopy. Atmospheric Environment. 22(5): 869-884.

3.

Baldocchi, D.D., Hicks, B.B. and Camara, P. 1987. A canopy stomatal resistance model for gaseous deposition to vegetated surfaces. Atmospheric Environment. 21(1): 91-101.

4.

Baro, F., Chaparro, L., Gomez-Baggethun, E., Langemeyer, J., Nowak, D.J. and Terradas, J. 2014. Contribution of ecosystem services to air quality and climate change mitigation policies: The case of urban forests in Barcelona, Spain. A Journal of Environment and Society. 43(3): 466-479.

5.

Bidwell, R.G.S. and Fraser, D.E. 1972. Carbon monoxide uptake and metabolism by leaves. Canadian Journal of Botany. 50(7): 1435-1439.

6.

Bottalico, F. et al. 2016. Air pollution removal by green infrastructures and urban forests in the city of Florence. Agriculture and agricultural science procedia 8: 243-251.

7.

Choi, S.M., Park, C.R., Park, W.H., Yeo, J.H., Yoo, S.Y., Oh, S.R., Jo, J.H. 2021. Aican’s Green Infrastructure Survey Report 2021. National Institute of Forest Science. Research Article No. 952

8.

Chow, P., Rolfe, G.L. 1989. Carbon and hydrogen contents of short-rotation biomass of five hardwood species. Wood and Fiber Science. 21(1): 30-36.

9.

Cohen, A.J., Anderson, H.R., Ostro, B., Pandey, K.D., Krzyzanowski, M., Künzli, N. and Smith, K.R. 2004. Urban air pollution. Comparative Quantification of Health Risks: Global and Regional Burden of Disease Attributable to Selected Major Risk Factors 2: 1353-1433.

10.

Endreny, T., Santagata, R., Perna, A., De Stefano, C., Rallo, R.F., and Ulgiati, S. 2017. Implementing and managing urban forests: A much needed conservation strategy to increase ecosystem services and urban wellbeing. Ecological Modelling 360: 328-335.

11.

Farrell, T. 2015. Valuing London’s Urban Forest: Treeconomics London.

12.

Ghorani-Azam, A., Riahi-Zanjani, B. and Balali-Mood, M. 2016. Effects of air pollution on human health and practical measures for prevention in Iran. Journal of Research in Medical Sciences: The Official Journal of Isfahan University of Medical Sciences 21.

13.

Gwak, D.A, Ha, S.Y., Choi, S.M., Park, C.R. 2020. The Method of evaluating and investgating the value of urban Forest based on i-Tree Eco. National Institute of Forest Science. Research Article No. 861.

14.

Hirabayashi, S., Kroll, C.N., Nowak, D.J. 2012. Development of a distributed air pollutant dry deposition modeling framework. Environmental Pollution 171: 9-17.

15.

Hosker, R.P. and Lindberg, S.E. 1982. Review: atmospheric deposition and plant assimilation of gases and particles. Atmospheric Environment 16(5): 889-910.

16.

Interagency Working Group on Social Cost of Carbon, United States Government. 2015. Technical Support Document: Technical Update of the Social Cost of Carbon for Regulatory Impact Analysis Under Executive Order 12866. http://www.whitehouse.gov/sites/default/files/omb/inforeg/scc-tsd-final-july-2015.pdf

17.

Jeong, S.H. 1985. A study on the diameter increment of major conifers in middle area of Korea. Journal of Korean Society of Forest Science 60(1): 52-59.

18.

Jo, H.K. 1999. Carbon uptake and emissions in urban landscape, and the role of urban greenspace for several cities in Kangwon province. Journal of Korean Institute of Landscape Architecture 27(1): 39-53.

19.

Jo, H.K. 2001. Indicator for CO2 uptake and atmospheric purification evaluation of vegetation. development of eco-indicators for sustainable development. Research Report to Ministry of Environment.

20.

Jo, H.K. 2002. Impacts of urban greenspace on offsetting carbon emissions for middle Korea. Journal of Environmental Management 60(2): 115-126.

21.

Jo, H.K. 2019. Development of model and technology for establishment, management and evaluation of urban forests in living zone to improve carbon sequestration sources and multi-dimensional benefits against new climate change regime. Research Report to Korea Forest Service.

22.

Jo, H.K. and Ahn, T.W. 2001. Annual CO2 uptake and atmospheric purification by urban coniferous trees - For Pinus densiflora and Pinus koraiensis. Korean Journal of Environment and Ecology 15(2): 118-124.

23.

Jo, H.K. and Ahn, T.W. 2012. Carbon storage and uptake by deciduous tree species for urban landscape. Journal of the Korean Institute of Landscape Architecture 40(5): 160-168.

24.

Jo, H.K. and Cho, D.H. 1998. Annual CO2 uptake by urban popular landscape tree species. Journal of the Korean Institute of Landscape Architecture 26(2): 38-53.

25.

Jo, H.K. and Park, H.M. 2017. Changes in growth rate and carbon sequestration by age of landscape trees. Journal of the Korean Institute of Landscape Architecture 45(5): 97-104.

26.

Jo, H.K., Kil, S.H., Park, H.M. and Kim, J.Y. 2019c. Carbon reduction by and quantitative models for landscape tree species in southern region - For Camellia japonica, Lagerstroemia indica, and Quercus myrsinaefolia. Journal of the Korean Institute of Landscape Architecture 47(3): 31-38.

27.

Jo, H.K., Kim, J.Y. and Park, H.M. 2013. Carbon storage and uptake by evergreen trees for urban landscape - For Pinus densiflora and Pinus koraiensis. Korean Journal of Environment and Ecology 27(5): 571-578.

28.

Jo, H.K., Kim, J.Y. and Park, H.M. 2014. Carbon reduction effects of urban landscape trees and development of quantitative models - For five native species. Journal of the Korean Institute of Landscape Architecture 42(5): 13-21.

29.

Jo, H.K., Kim, J.Y. and Park, H.M. 2019a. Carbon reduction and planning strategies for urban parks in Seoul. Urban Forestry & Urban Greening 41: 48-54.

30.

Jo, H.K., Kim, J.Y. and Park, H.M. 2019b. Carbon reduction services of evergreen broadleaved landscape trees for Ilex rotunda and Machilus thunbergii in Southern Korea. Journal of Forest and Environmental Science 35(4): 240-247.

31.

Killus, J.P., Meyer, J.P., Durran, D.R., Anderson, G.E., Jerskey, T.N. [et al.]. 1984. Continued research in mesoscale air pollution simulation modeling. Volume V: refinements in numerical analysis, transport, chemistry, and pollutant removal. Publ. EPA/600/3-84/095a. Research Triangle Park, NC: U.S. Environmental Protection Agency.

32.

Kubal, C., Haase, D., Meyer, V., Scheuer, S.J.N. 2009. Integrated urban flood risk assessment–adapting a multicriteria approach to a city. Natural Hazards and Earth System Science 9(6): 1881-1895.

33.

Lee, G.G. 2003. Sustainability indicators of Greenspace in Apartment Sites, Seoul National University, Doctoral thesis.

34.

Lin, J. 2020. Developing a composite indicator to prioritize tree planting and protection locations. Science of The Total Environment 717: 137269.

35.

Lovett, G.M. 1994. Atmospheric deposition of Nutrients and pollutants in North American. Ecological Applications 4(4): 629-650.

36.

Lutz, J.A. Larson, A.J., Freund, J.A., Swanson, M.E., and BiblE, K.J. 2013. The importance of large-diameter trees to forest structural heterogeneity. PLoS One 8(12): e82784.

37.

McPherson, E.G., Maco, S.E., Simpson, J.R., Peper, P.J., Xiao, Q., VanDerZanden, A.M. and Bell, N. 2002. Western Washington and Oregon Community Tree Guide: Benefits, Costs, and Strategic Planting. International Society of Arboriculture, Pacific Northwest, Silverton, OR.

38.

McPherson, E.G., Simpson, J.R., Peper, P.J. and Xiao, Q. 1999. Tree guidelines for san joaquin valley communities. Local Government Commission, Sacramento, CA.

39.

McPherson, E.G., Simpson, J.R., Peper, P.J., Crowell, A.M.N. and Xiao, Q. 2010. Northern California coast community tree guide: benefits, costs, and strategic planting. PSW-GTR-228. Gen. Tech. Rep. PSW-GTR-228. U.S. Department of Agriculture, Forest Service, Pacific Southwest Research Station, Albany, CA.

40.

McPherson, E.G., Simpson, J.R., Peper, P.J., Gardner, S.L., Vargas, K.E. and Xiao, Q. 2007. Northeast community tree guide: benefits, costs, and strategic planting.

41.

McPherson, E.G., Simpson, J.R., Peper, P.J., Gardner, S.L., Vargas, K.E., Maco, S.E. and Xiao, Q. 2006a. Coastal Plain Community Tree Guide: Benefits, Costs, and Strategic Planting PSW-GTR-201. USDA Forest Service, Pacific Southwest Research Station, Albany, CA.

42.

McPherson, E.G., Simpson, J.R., Peper, P.J., Maco, S.E., Gardner, S.L., Cozad, S.K. and Xiao, Q. 2006b. Midwest Community Tree Guide: Benefits, Costs and Strategic Planting PSW-GTR-199. U.S. Department of Agriculture, Forest Service, Pacific Southwest Research Station, Albany, CA.

43.

McPherson, E.G., Simpson, J.R., Peper, P.J., Maco, S.E., Gardner, S.L., Vargas, K.E. and Xiao, Q. 2006c. Piedmont Community Tree Guide: Benefits, Costs, and Strategic Planting PSW-GTR 200. U.S. Department of Agriculture, Forest Service, Pacific Southwest Research Station, Albany, CA.

44.

McPherson, E.G., Simpson, J.R., Peper, P.J., Maco, S.E., Xiao Q. and Mulrean, E. 2004. Desert Southwest Community Tree Guide: Benefits, Costs and Strategic Planting. Phoenix, AZ: Arizona Community Tree Council, Inc. 81: 81.

45.

McPherson, E.G., Simpson, J.R., Peper, P.J., Scott, K.I. and Xiao, Q. 2000. Tree Guidelines for Coastal Southern California Communities. Local Government Commission, Sacramento, CA.

46.

McPherson, E.G., Simpson, J.R., Peper, P.J., Xiao, Q., Maco, S.E. and Hoefer, P.J. 2003. Northern Mountain and Prairie Community Tree Guide: Benefits, Costs and Strategic Planting. Center for Urban Forest Research, USDA Forest Service, Pacific Southwest Research Station, Albany, CA.

47.

McPherson, E.G., Simpson, J.R., Peper, P.J., Xiao, Q., Pittenger, D.R. and Hodel, D.R. 2001. Tree Guidelines for Inland Empire Communities. Local Government Commission, Sacramento, CA.

48.

Myeong, S., Nowak, D.J. and Duggin, M.J. 2006. A temporal analysis of urban forest carbon storage using remote sensing. Remote Sensing of Environment 101(2): 277-282.

49.

Nowak, D.J. 1994. Atmospheric carbon dioxide reduction by Chicago’s urban forest. In: McPherson, E.G.; Nowak, D.J.; Rowntree, R.A., eds. Chicago’s urban forest ecosystem: results of the Chicago Urban Forest Climate Project. Gen. Tech. Rep. NE-186. Radnor, PA: U.S. Department of Agriculture, Forest Service, Northeastern Forest Experiment Station: 83-94.

50.

Nowak, D.J. 2024. Understanding i-Tree: 2023 summary of programs and methods. General Technica Report NRS-200-2023. Madison, WI: U.S. Department of Agriculture, Forest Service, Northern Research Station. 103. https://doi.org/10.2737/NRS-GTR-200-2023.

51.

Nowak, D.J. and Crane, D.E. 2000. The Urban Forest Effects (UFORE) Model: quantifying urban forest structure and functions.

52.

Nowak, D.J., McHale, P.J., Ibarra, M., Crane, D., Stevens, J. and Luley, C. 1998. Modeling the effects of urban vegetation on air pollution. In: Gryning, S.E.; Chaumerliac, N., eds. Air pollution modeling and its application, XII. New York, NY: Plenum Press: 399-407.

53.

Nowak, D.J., Crane, D.E. and Dwyer, J.F. 2002a. Compensatory value of urban trees in the United States. Journal of Arboriculture 28(4): 194-199.

54.

Nowak, D.J. and Crane, D.E. 2002b. Carbon storage and sequestration by urban trees in the USA. Environmental Pollution 116(3): 381-389.

55.

Nowak, D.J., Crane, D.E., Stevens, J.C. and Ibarra, M. 2002c. Brooklyn’s urban forest. Gen. Tech. Rep. NE-290. Newtown Square, PA: U.S. Department of Agriculture, Forest Service, Northeastern Research Station. 107 p.

56.

Nowak, D.J., Hoehn, R.H., Crane, D.E., Stevens, J.C. and Walton, J.T. 2006a. Assessing urban forest effects and values: Washington, DC’s urban forest. Newtown Square (PA): U.S. Department of Agriculture, Forest Service, Northern Research Station; 24 p. Resource Bulletin NRS-1.

57.

Nowak, D.J., Crane, D.E. and Stevens, J.C. 2006b. Air pollution removal by urban trees and shrubs in the United States. Urban Forestry & Urban Greening 4(3-4): 115-123.

58.

Nowak, D.J., Hoehn, R.H., Crane, D.E., Stevens, J.C. and Walton, J.T. 2006c. Assessing urban forest effects and values: Casper’s urban forest. Newtown Square (PA): U.S. Department of Agriculture, Forest Service, Northern Research Station; 20 p. Resource Bulletin NRS-4.

59.

Nowak, D.J., Hoehn, R., Crane, D.E., Stevens, J.C. and Walton, J.T. 2007a. Assessing urban forest effects and values, San Francisco’s urban forest. Newtown Square, PA: U.S. Department of Agriculture, Forest Service, Northern Research Station. 22 p.

60.

Nowak, D.J., Hoehn, R., Crane, D.E., Stevens, J.C. and Walton, J.T. 2007b. Assessing urban forest effects and values, Philladelphia’s urban forest. Newtown Square, PA: U.S. Department of Agriculture, Forest Service, Northern Research Station. 22 p.

61.

Nowak, D.J., Hoehn, R., Crane, D.E., Stevens, J.C. and Walton, J.T. 2007c. Assessing urban forest effects and values, New York City’s urban forest. Newtown Square, PA: U.S. Department of Agriculture, Forest Service, Northern Research Station. 22 p.

62.

Nowak, D.J., Hoehn, R. and Crane, D. 2007d. Oxygen production by urban trees in the United States. Arboriculture & Urban Forestry 33(3): 220-226.

63.

Nowak, D.J., Hirabayshi, S., Bodine, A. and Hoehn, R. 2013. Modeled PM2.5 removal by trees in ten U.S. cities and associated health effects. Environmental Pollution. 178: 395-402. https://doi.org/10.1016/j.envpol.2013.03.050.

64.

Park, W.G. 1988. Diameter Growth and Key-Year in Pinus koraiensis and Pinus densiflora Trees.

65.

Pederson, J.R. et al. 1995. California ozone deposition experiment: methods, results, and opportunities. Atmospheric Environment 29(21): 3115-3132. https://doi.org/10.1016/1352-2310(95)00136-m.

66.

Ramanathan V. and Feng Y. 2009. Air pollution, greenhouse gases and climate change: Global and regional perspectives. Atmospheric Environment 43: 37-50

67.

Raum, S., Hand, K.L., Hall, C., Edwards, D.M., O’Brien, L. and Doick, K.J. 2019. Achieving impact from ecosystem assessment and valuation of urban greenspace: The case of i-Tree Eco in Great Britain. Landscape and Urban Planning 190: 103590. https://doi.org/10.1016/j.landurbplan.

68.

Sally, R., Sharon, J.P., Wayne, C., Neil, G., Jamie, H. and John, Z. 2020. i-Tree eco analysis of landscape vegetation on remediated areas of oak ridge national laboratory. Scientific Research Publishing 10(4): 412-427. DOI:

69.

Son, Y.M, Lee, K.H. and Chung, Y.G. 1997. Stand growth estimation using nonlinear growth equations. Journal of Korean Society of Forest Science 86(2): 135-145. KangWon National University. Master’s thesis.

70.

Song, P., Kim, G.W., Mayer, A., He, R. and Tian, G. 2020. Assessing the ecosystem services of various types of urban green spaces based on i-tree Eco. Sustainability 12(4): 1630. doi:

71.

Tzoulas, K., Korpela, K., Venn, S., Yli-Pelkonen, V., Kazmierczak, A., Niemela, J. and James, P. 2007. Promoting ecosystem and human health in urban areas using Green Infrastructure: A literature review. Landscape and Urban Planning 81(3): 167-178.

72.

U.S. Environmental Protection Agency. 2015. The social cost of carbon. http://www.epa.gov/climatechange/EPAactivities/economics/scc.html

73.

Uttara, S., Bhuvandas, N. and Aggarwal, V. 2012. Impacts of urbanization on environment. International Journal of Research in Engineering and Applied Sciences 2(2): 1637-1645.

74.

Van Essen, H., Schroten, A., Otten, M., Sutter, D., Schreyer, C., Zandonella, R., Maibach, M. and Doll, C. 2011. External Costs of Transport in Europe. Netherlands: CE Delft. 161 p.

75.

Wang, J., Endreny, T.A. and Nowak, D.J 2008. Mechanistic simulation of tree effects in an urban water balance model. Journal of the American Water Resources Association 44(1): 75-85.

76.

Wesely, M.L. 1989. Parameterization for surface resistance to gaseous dry deposition in regional-scale numerical models. Atmospheric Environment. 23(6): 1293-1304. https://doi.org/10.1016/j.atmosenv.2007.10.058.

77.

Yin, J., Ye, M. and Yin, Z.A. 2015. Review of advances in urban flood risk analysis over China. Stochastic Environmental Research and Risk Assessment Planning 29: 1063-1070.

78.

Zhang, B., Li, N. and Wang, S. 2015. Effect of urban green space changes on the role of rainwater runoff reduction in Beijing, China. Landscape and Urban Planning 140: 8-16.

79.

Zinke, P.J. 1967. Forest interception studies in the United States. In: Sopper, W.E.; Lull, H.W., eds. Forest hydrology. Oxford, UK: Pergamon Press: 137-161.