Introduction
The genus Prunus L. belongs to the subfamily Amygdaloideae of the Rosaceae family and comprises approximately 200 species of shrubs and trees distributed primarily in temperate regions of the Northern Hemisphere, as well as in tropical areas of Asia and the Americas (Kalkman, 2004; Akšić et al., 2020a, 2020b). In South Korea, 21 taxa of Prunus species have been documented, with 14 taxa identified as native species (Lee and Kim, 2007).
Prunus species are widely cultivated for fruit production (e.g., cherries) and ornamental purposes, contributing significantly to biodiversity conservation, ecosystem services, and cultural landscapes (Shi et al., 2013). This study focuses on three species: Prunus sargentii Rehder, Prunus × yedoensis Matsum., and Prunus spachiana (Lavallée ex H. Otto) Kitam. Among them, P. × yedoensis, commonly known as Yoshino cherry, is one of the most widely planted ornamental trees globally due to its high aesthetic value (Matsumura, 1901; Shi et al., 2013). According to cumulative data from the Korea Forest Service (2025), among approximately 10.98 million urban street trees in South Korea, 1.63 million (15%) are Prunus species, with 69% of them being P. × yedoensis. Due to the low germination rate of seeds, vegetative propagation through grafting onto P. sargentii or P. jamasakura rootstocks is commonly used for mass propagation (Kim, 2004). Additionally, Prunus species exhibit strong self-incompatibility, facilitating hybridization, which is sometimes induced for breeding purposes (Kuitert and Peterse, 1999; Liu et al., 2007; Cho and Kim, 2019a, 2019b). However, some hybridized individuals exhibit low fruit set and germination rates, making sexual reproduction challenging (Cho et al., 2017).
Research on flowering phenology and plant-pollinator dynamics has gained momentum due to increasing concerns about climate change and its potential impact on ecosystem services (Menzel et al., 2020). Studies have reported advancing flowering times in Prunus species, particularly in P. sargentii and P. × yedoensis, which are highly sensitive to temperature fluctuations (Primack et al., 2015). Changes in flowering phenology affect pollinator availability, fruit set, and seed dispersal success (Aono and Kazui, 2008). Furthermore, previous research has emphasized the significance of light intensity, soil characteristics, and temperature in determining flowering intensity and growth rates in Prunus species (Kudo and Ida, 2013).
Despite the increasing number of studies on Prunus species, comparative studies investigating flowering characteristics and floral nectar dynamics within the same habitat remain limited (Yoshikawa and Maki, 2020). Both genetic and environmental factors influence flowering and growth, but previous research has predominantly focused on either environmental or genetic variables, leaving a gap in our understanding of their combined effects on flowering time and nectar characteristics (Rathcke and Lacey, 1985; Petanidou and Smets, 1996; Franks et al., 2007; Pacini and Nepi, 2007; Wang et al., 2012; Denisow and Wrzesień, 2015). This gap is evident in studies that emphasize environmental factors, such as temperature and precipitation, while neglecting the potential influence of genetic variability on floral traits (Petanidou and Smets, 1996; Denisow and Wrzesień, 2015). Similarly, investigations into genetic determinants of flowering time often fail to consider environmental interactions, resulting in an incomplete understanding of these processes (Franks et al., 2007; Wang et al., 2012). Therefore, a comparative and integrated approach is necessary to address this gap, enabling a better understanding of the ecological roles and practical applications of these species.
Prunus species are vital nectar and pollen sources for honeybees (Apis mellifera) and other wild pollinators, especially during the early spring when pollinator activity begins (Yoshikawa and Maki, 2020). However, few studies have conducted direct comparisons of floral traits and nectar composition across Prunus species under consistent environmental conditions. The present study aims to investigate interspecific variation in floral morphology, nectar characteristics, and honey production potential among three Prunus species (P. × yedoensis, P. sargentii, and P. spachiana) grown within the same habitat. By conducting this comparison in a shared environment, we minimized the influence of external environmental factors, allowing us to attribute observed differences primarily to genetic variation (Whitney, 2009; Datson et al., 2011; Mertens et al., 2018; Wu et al., 2019). Specifically, we hypothesized that:
-
genetically distinct Prunus species exhibit significant differences in floral morphology, nectar volume, sugar concentration, and amino acid composition; and
-
these floral traits have measurable effects on honey yield and pollinator support capacity.
Through this integrated approach, our findings aim to provide insight into species-specific ecological functions and guide forest managers in selecting Prunus species with high ecological and economic value for apiculture and biodiversity conservation.
Materials and Methods
The study was conducted at two research sites in South Korea. The first site was the Department of Forest Bioresources of the National Institute of Forest Science, located in Suwon, Gyeonggi Province (37° 15′ 55″ N, 126° 57′ 29.9″) where P. spachiana was examined. Due to the limited availability of suitable individuals within the same environmental conditions, only one P. spachiana tree was surveyed. Although the sample size was restricted for this species, its inclusion was deemed valuable for interspecific comparison under uniform habitat conditions. The second site was the Experimental Forest in Hwaseong, Gyeonggi Province (37° 15′ 45″ N, 126° 55′ 29″), where five individuals of P. × yedoensis and five individuals of P. sargentii were surveyed. Individual trees were selected based on their health, flowering status, and accessibility for consistent monitoring and sampling.
To assess the flowering period and blooming rate, five flowering branches were selected from each tree, with each branch oriented in a different cardinal direction. Blooming rate calculations were performed based on the proportion of open flowers, and full bloom was defined as the stage when more than 60% of flowers had opened.
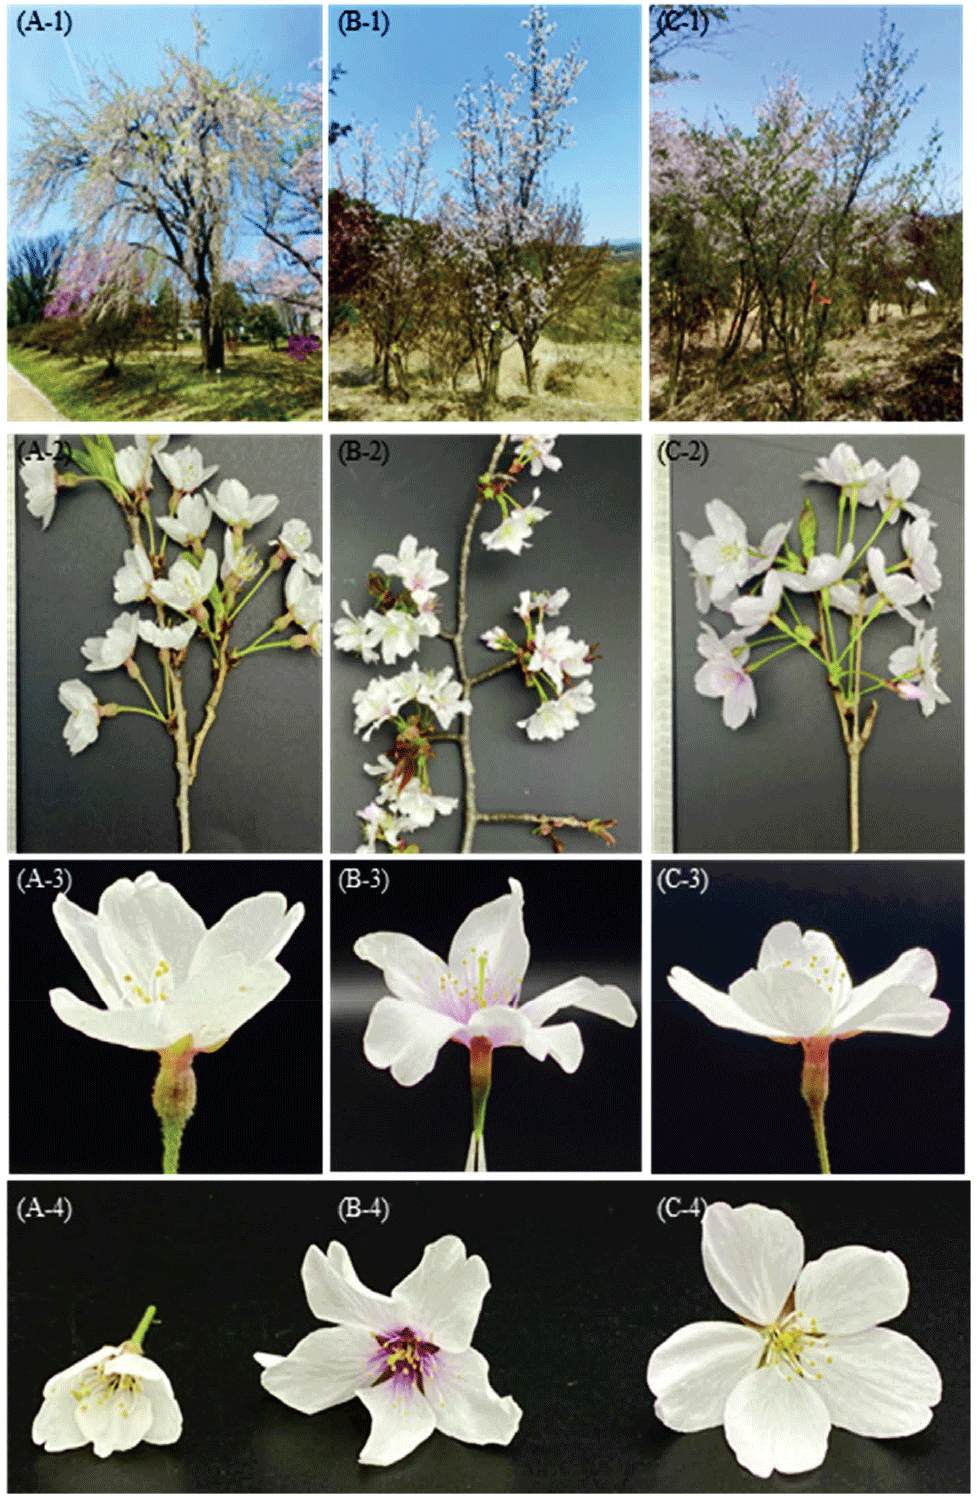
Species identification was conducted based on morphological floral characteristics (Figure 1). The presence or absence of trichomes on the style was a key diagnostic feature: both P. × yedoensis and P. spachiana exhibited trichomes, while P. sargentii displayed a glabrous style. Additional morphological traits were used to distinguish the species further. P. spachiana was identified by its urn-shaped hypanthium [Figure 1(A)] and pendulous branching habit. P. sargentii was characterized by the lack of trichomes, smooth sepals without serration, a short peduncle, and a second-order pedicel forming an umbellate inflorescence [Figure 1(B)]. P. × yedoensis, a cultivated, clone-forming species (Katsuki and Iketani, 2016), was distinguished by its cup-shaped hypanthium and serrated sepals [Figure 1(C)].
To quantify floral nectar secretion, five healthy and mature trees of each Prunus species were selected. Any open flowers were removed before the study began to prevent nectar loss by nectar-feeding insects. Branches containing pre-bloom inflorescences were subsequently enclosed in pollination bags to create a controlled environment and exclude insect pollinators.
The flowering patterns of the selected branches were monitored throughout the study, given the flowers’ approximate two-day lifespan. To standardize nectar collection, the time of flower opening was recorded. A flower-marking method was applied, whereby flowers that had bloomed one day after the installation of pollination bags, specifically at 2:00 p.m., were marked for subsequent collection (Broyles and Stoj, 2019). This approach ensured consistency across replicates and minimized potential variability caused by developmental differences in nectar secretion rates.
Nectar secretion patterns were tracked from flower opening until petal drop, with measurements consistently taken at 2:00 p.m. to facilitate data comparability across samples. Nectar collection for the three Prunus species was performed on April 6, with the following sample sizes:
Nectar was collected using sterile 50 mL centrifuge tubes, each fitted with a 0.3 mm mesh filter to remove debris and potential contaminants. Subsequently, the samples were centrifuged at 4,000 rpm for 4 minutes to further separate any remaining particulate matter (Armstrong and Paton, 1990). The total nectar volume was measured using a calibrated 50 μL micro-syringe (Hamilton Co., Reno, NV, USA).
For additional purification, an 80% ethanol solution was added at a 10-fold dilution ratio, followed by filtration through a 0.45 μm centrifuge filter (Millipore, Billerica, MA, USA) to remove any residual pollen or impurities. The purified nectar samples were stored at −20°C until subsequent analyses of sugar composition and amino acid content were performed.
The free sugar composition of floral nectar was analyzed using high-performance liquid chromatography (HPLC, Dionex Ultimate 3000; Dionex, Sunnyvale, CA, USA). Deionized water was employed as the mobile phase, with a flow rate set to 0.5 mL/min to ensure efficient sugar separation. The column oven temperature was maintained at 80°C to optimize sugar elution and resolution.
Detection was carried out using a Shodex RI-101 refractive index detector (Showa Denko, New York, NY, USA) in conjunction with an Aminex 87P column (300 × 7.8 mm, Bio-Rad, Hercules, CA, USA). The free sugar concentration was quantified using the external standard method, which relies on integral meter measurements for calibration. High-purity (≥99.5%) sucrose, glucose, and fructose standards (Sigma Aldrich, St. Louis, MO, USA) were used as reference compounds to ensure accuracy and reproducibility in the quantification process.
The amino acid composition of the collected nectar samples was analyzed using OPA (o-phthalaldehyde) and FMOC (fluorenylmethyl chloroformate) derivatization. Sample preparation involved sequential mixing with borate buffer, OPA/mercaptopropionic acid (MPA), and FMOC reagent to facilitate amino acid derivatization.
The analysis was performed using an HPLC 1200 series system (Agilent Technologies, Santa Clara, CA, USA). The mobile phase consisted of two solutions:
Solution A: 10 mM Na2HPO4 and 10 mM Na2B4O7 · 10H2O, adjusted to pH 8.2.
Solution B: A mixture of water, acetonitrile, and methanol in a 10:45:45 ratio.
Gradient elution conditions were applied, starting with 100:0 (v/v, %) of solution A, transitioning to 0:100 from 26 to 28 minutes, and subsequently returning to 100:0 after 30.5 minutes. The flow rate was maintained at 1.5 mL/min, with an injection volume of 1 mL per sample.
Separation was achieved using an INNO C-18 column (150 mm × 4.6 mm, 5 μm; Youngjin Biochrom Co., Ltd., Seongnam, Republic of Korea) at a constant temperature of 40°C. The OPA derivative was detected using a fluorescence detector, with an emission wavelength of 450 nm and an excitation wavelength of 340 nm. The UV detector was set to 338 nm. For FMOC derivatives, emission and excitation wavelengths were adjusted to 305 nm and 266 nm, respectively.
To estimate the total number of flowers per tree, we first assessed the average number of flowers per branch. Given the natural variability in tree architecture and growth conditions, it was not feasible to find individuals with identical crown structures. Therefore, we selected branches of similar size and developmental stage from each tree, avoiding unusually small or oversized branches (Balan and Ivanov, 2014; Han et al., 2019; Balan et al., 2023). For each species, the number of flowers was counted on 10 representative branches per tree to obtain a reliable average flower count per branch (Han et al., 2019; Xu et al., 2023). Subsequently, we counted the total number of branches per tree and extrapolated the total flower number by multiplying the average flower count per branch by the total number of branches (Han et al., 2019; Xu et al., 2023). This method minimized error by standardizing the sampling approach and accounting for intra-tree variability in flowering abundance (Balan and Ivanov, 2014; Han et al., 2019; Balan et al., 2023; Xu et al., 2023).
The potential honey yield was estimated based on measurements of nectar secretion rate (μL/flower), free sugar concentration (μg/μL), total number of flowers per plant, and honey conversion efficiency (Na et al., 2024; Petanidou, 2023). To ensure comparability across species, the population density per hectare was calculated based on tree planting density. Using these parameters, the total honey production per hectare (kg/ha) was subsequently determined. The following equations were applied for the calculations:
Honey production (mg/tree) = nectar sugar content (mg/flower)1 × number of flowers (ea/tree) × honey potential (1.15)2
1Nectar sugar content (mg/flower) = nectar volume (μL/flower) × free sugar content (μg/μL) × 0.001 (for unit conversion: μg to mg)
2Honey potential = sugar content: honey = 85:100
Honey yield (kg/ha) = honey production (mg/tree) × number of trees (ea/ha) × 0.000001 (for unit conversion: mg to kg).
Statistical analyses were performed to evaluate differences in growth parameters, nectar volume, sugar concentration (sucrose, glucose, and fructose), and amino acid composition. One-way analysis of variance (ANOVA) was applied, followed by Tukey’s Honestly Significant Difference (HSD) test for post-hoc comparisons. All statistical tests were conducted using JMP 18.1.1 software (SAS Institute, Cary, NC, USA), with the significance level set at p < 0.05. Additionally, an independent t-test was conducted to compare the free sugar composition between P. sargentii and P. × yedoensis, providing insight into interspecific variation in floral nectar.
Results
Significant interspecific differences in floral morphology were observed among the three Prunus species examined (Figures 2 and 3). The mean corolla width varied notably across species, with P. × yedoensis exhibiting the largest average width (32.9 ± 1.8 mm), followed closely by P. sargentii (32.8 ± 2.0 mm). In contrast, P. spachiana displayed a significantly smaller corolla width (17.7 ± 1.7 mm). These differences were statistically significant (p < 0.05).
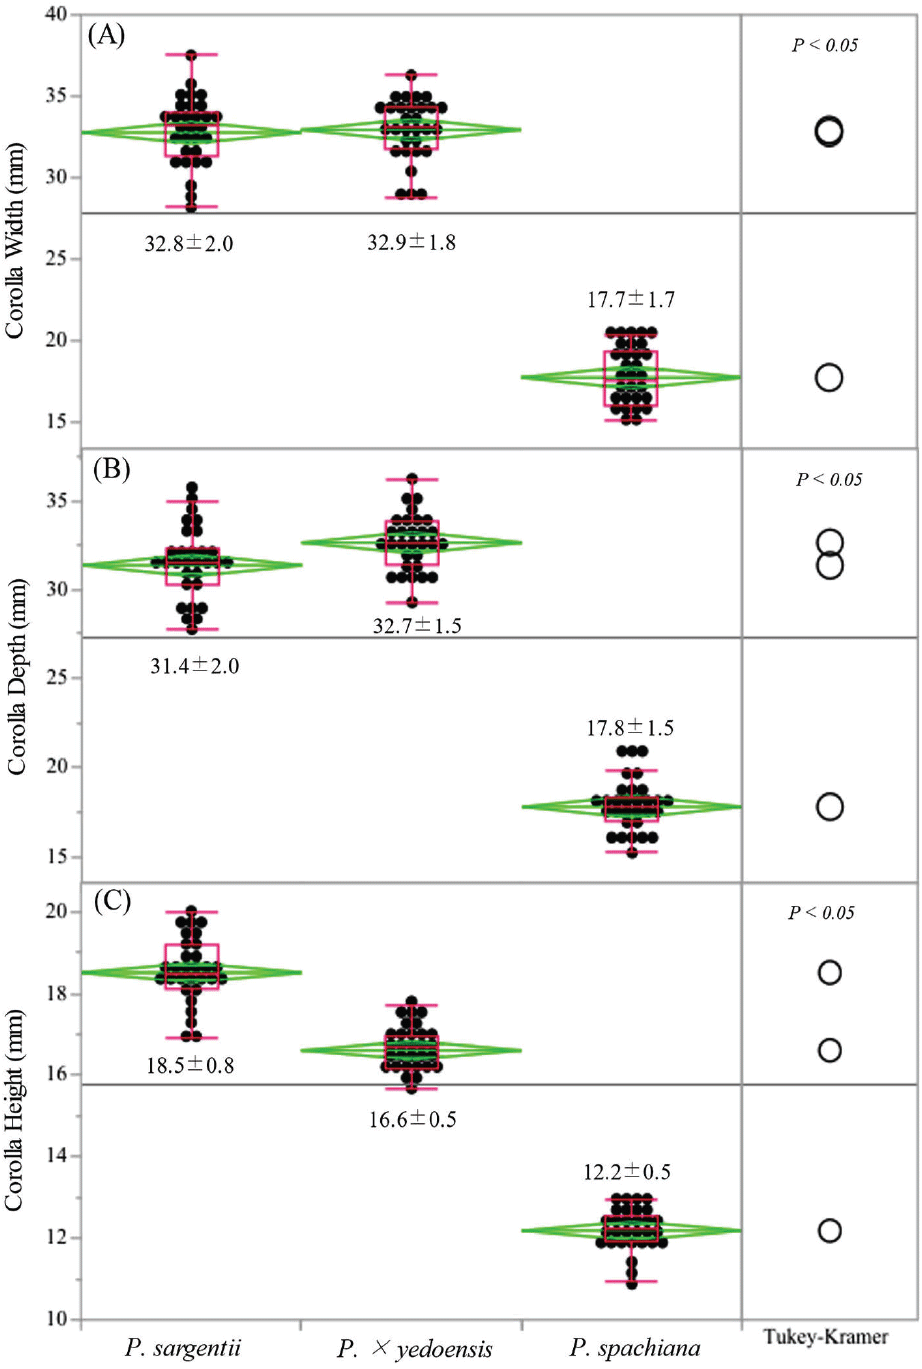
A similar trend was observed in corolla depth, where P. × yedoensis had the greatest mean depth (32.7 ± 1.5 mm), followed by P. sargentii (31.4 ± 2.0 mm). Both species showed significantly greater corolla depth compared to P. spachiana, which exhibited a mean depth of 17.8 ± 1.5 mm (Figure 2). The pronounced differences in corolla dimensions may reflect species-specific pollination strategies, potentially influencing the accessibility of floral resources to different pollinator groups.
Hypanthium height also differed significantly across the three species (Figure 3). P. × yedoensis exhibited the greatest hypanthium height (8.5 ± 0.6 mm), followed by P. sargentii (7.8 ± 0.6 mm) and P. spachiana (5.6 ± 0.5 mm).
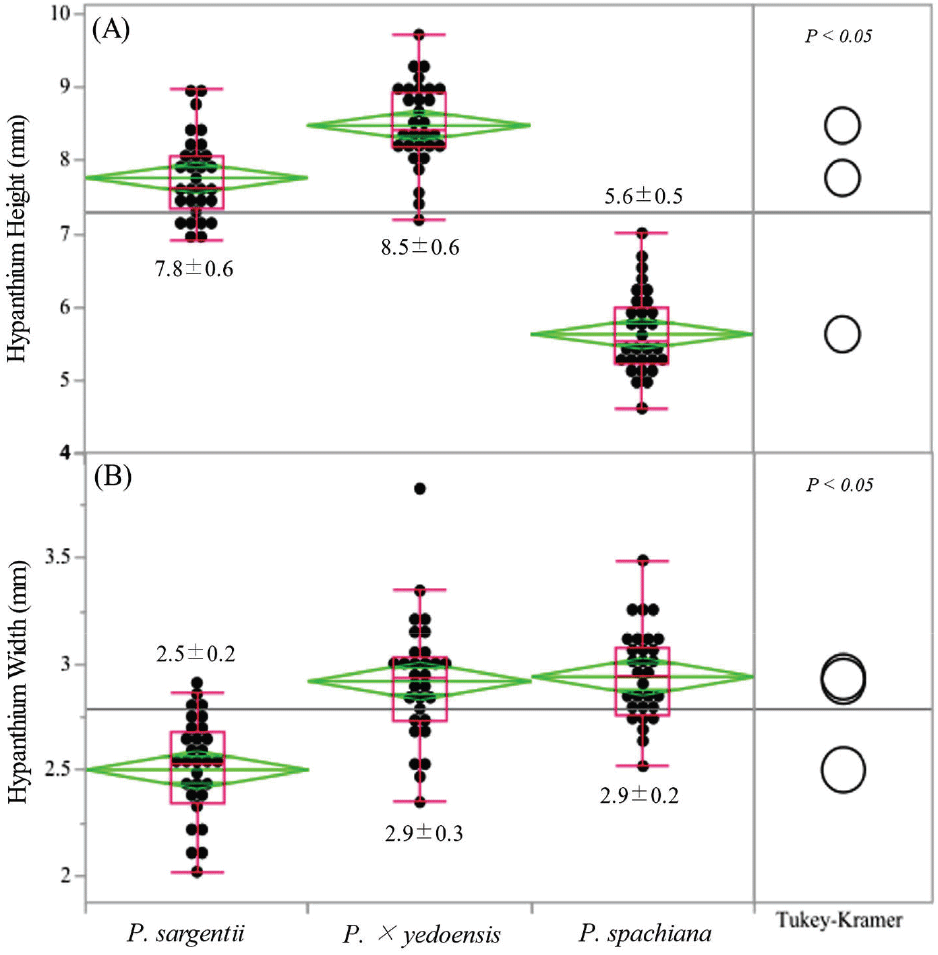
Figure 4 illustrates the total free sugar concentration in the nectar. P. spachiana exhibited the highest total sugar content, with 472 μg/μL, predominantly composed of sucrose. In contrast, P. sargentii and P. × yedoensis showed comparatively lower concentrations of sucrose, with 269 μg/μL and 233 μg/μL, respectively. The relative proportions of sucrose, glucose, and fructose varied among the species. In P. spachiana, sucrose accounted for 100% of the free sugar content. P. sargentii showed a more diverse composition, with sucrose comprising 81.4%, glucose 9.54%, and fructose 9.07%. Similarly, P. × yedoensis displayed 84.6% sucrose, 7.98% glucose, and 7.44% fructose. These patterns indicate a sucrose-dominant composition across all species, with a modest but noticeable increase in glucose and fructose in P. sargentii and P. × yedoensis.
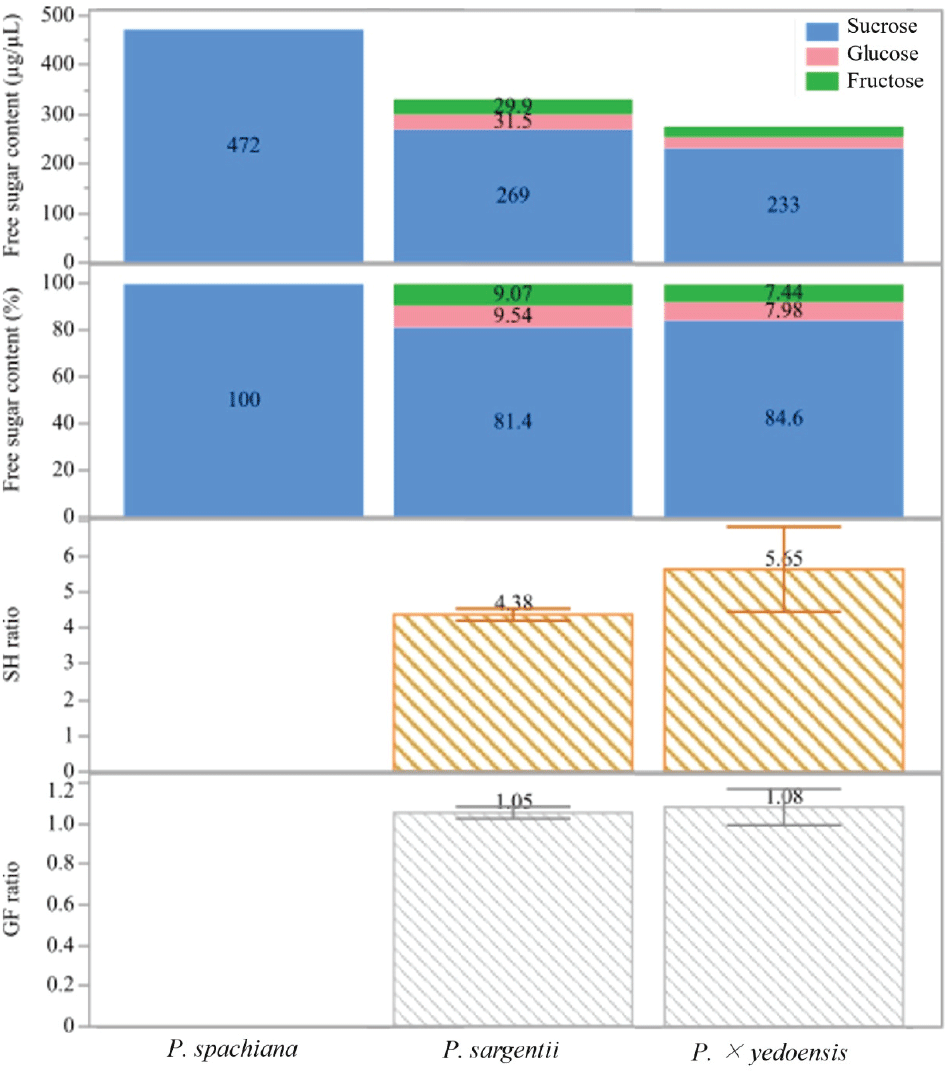
The S/H ratio, defined as the ratio of sucrose to the sum of glucose and fructose, further illustrates interspecific variation. P. spachiana had no measurable SH ratio due to the absence of hexoses. P. sargentii and P. × yedoensis exhibited S/H ratios of 4.38 and 5.65, respectively, suggesting a greater relative abundance of sucrose in the nectar of P. × yedoensis compared to P. sargentii. P. sargentii had a G/F ratio of 1.05, while P. × yedoensis presented a similar ratio of 1.08.
The analysis of nectar secretion and sugar composition revealed significant interspecific differences among the three Prunus species examined (Figure 5). The free sugar content per flower varied significantly across the species (p < 0.05). P. × yedoensis exhibited the highest free sugar content, with an average of 0.51 ± 0.15 mg/flower, followed by P. spachiana (0.47 ± 0.06 mg/flower) and P. sargentii (0.34 ± 0.04 mg/flower). Nectar volume per flower also differed significantly among species. P. × yedoensis produced the highest nectar volume, with 1.81 ± 0.12 μL/flower, whereas P. spachiana and P. sargentii secreted 1.11 ± 0.10 μL/flower and 1.03 ± 0.19 μL/flower, respectively.
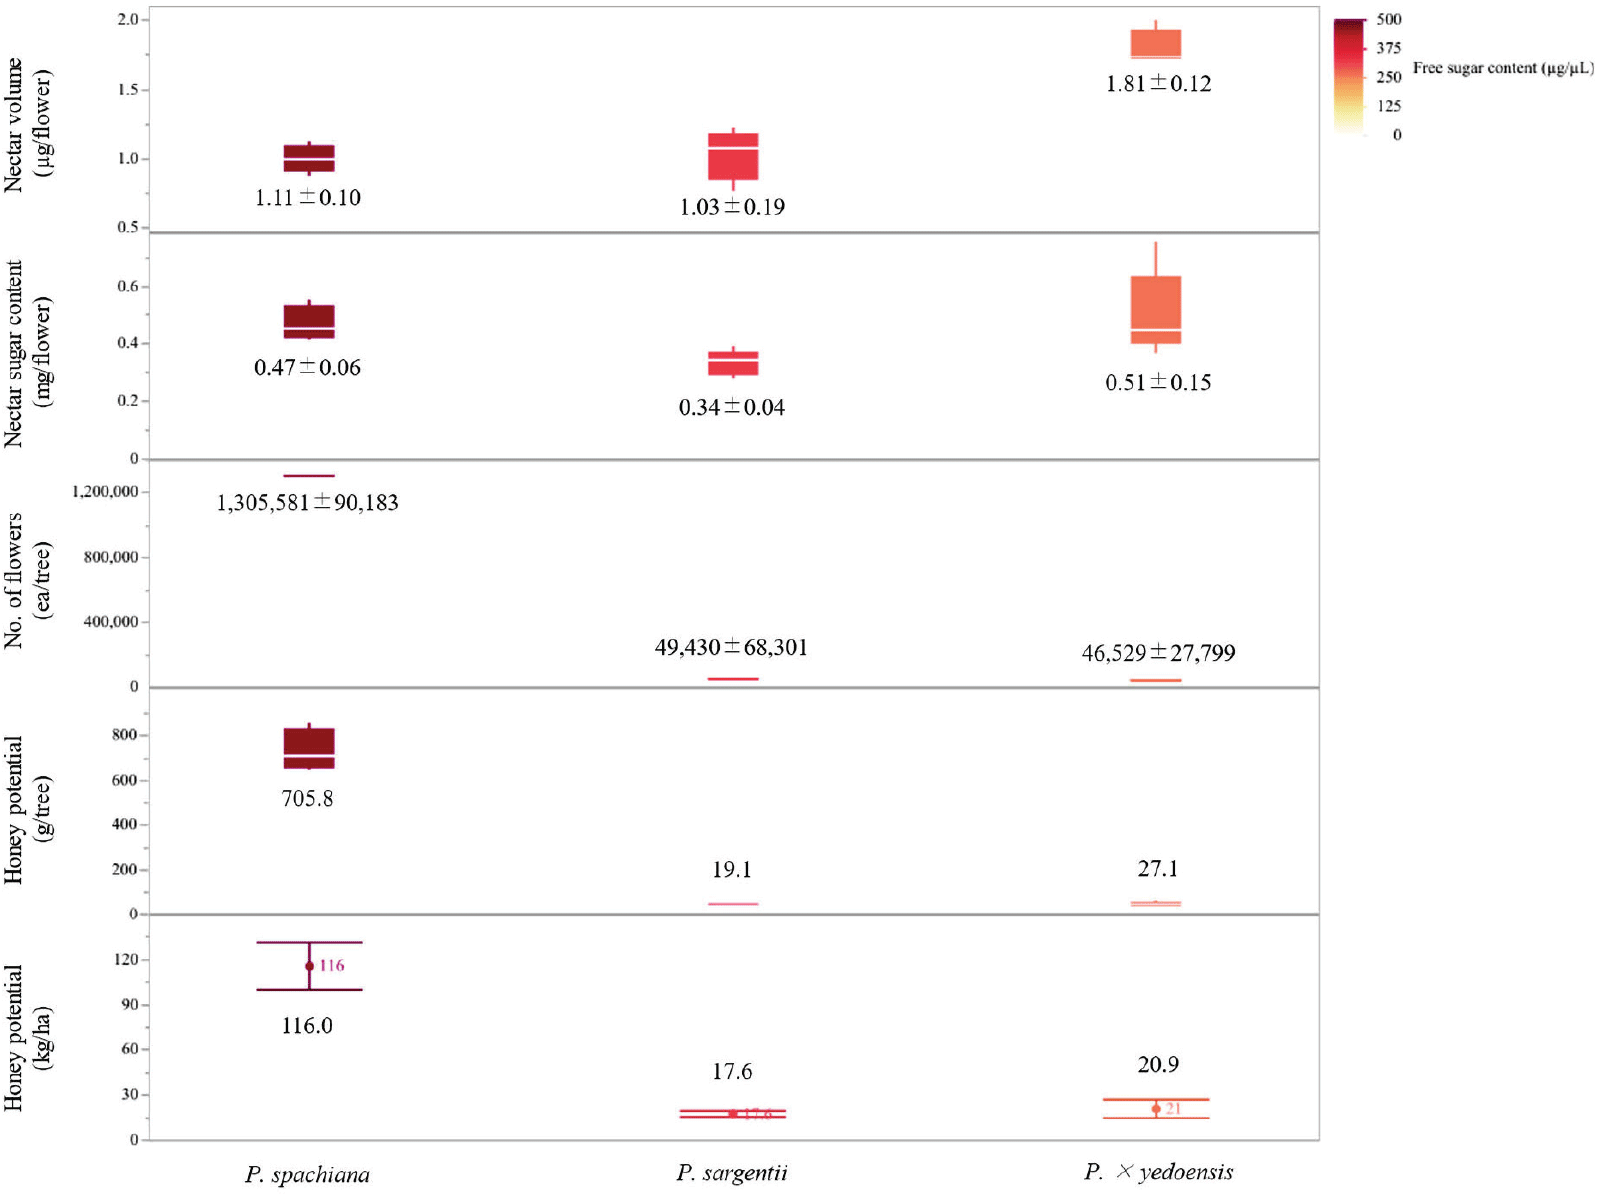
Floral abundance varied markedly among the three species, with P. spachiana exhibiting the highest average flower count per tree (1,305,581 ± 90,183 ea/tree). In contrast, P. sargentii and P. × yedoensis had significantly lower floral densities, with 49,430 ± 68,301 and 46,529 ± 27,799 flowers per tree, respectively. The notably higher flower count in P. spachiana indicates a substantial capacity for cumulative nectar production, despite its moderate per-flower nectar volume and sugar content.
Honey production estimates, calculated based on nectar volume, sugar content, and flower abundance, revealed significant variation among the three species (p < 0.05). P. spachiana demonstrated the highest honey yield potential, with 116.0 kg/ha, while P. × yedoensis and P. sargentii exhibited significantly lower yields of 20.9 kg/ha and 17.6 kg/ha, respectively.
Floral nectar analysis revealed significant interspecific differences in amino acid composition and concentration across the three Prunus species, with a total of 19 amino acids identified (Figure 6). The total amino acid content was highest in P. sargentii (742.4 ± 43.6 mg/L), followed by P. spachiana (669.7 ± 226.1 mg/L) and P. × yedoensis (657.4 ± 246.7 mg/L) [Figure 6(A)].
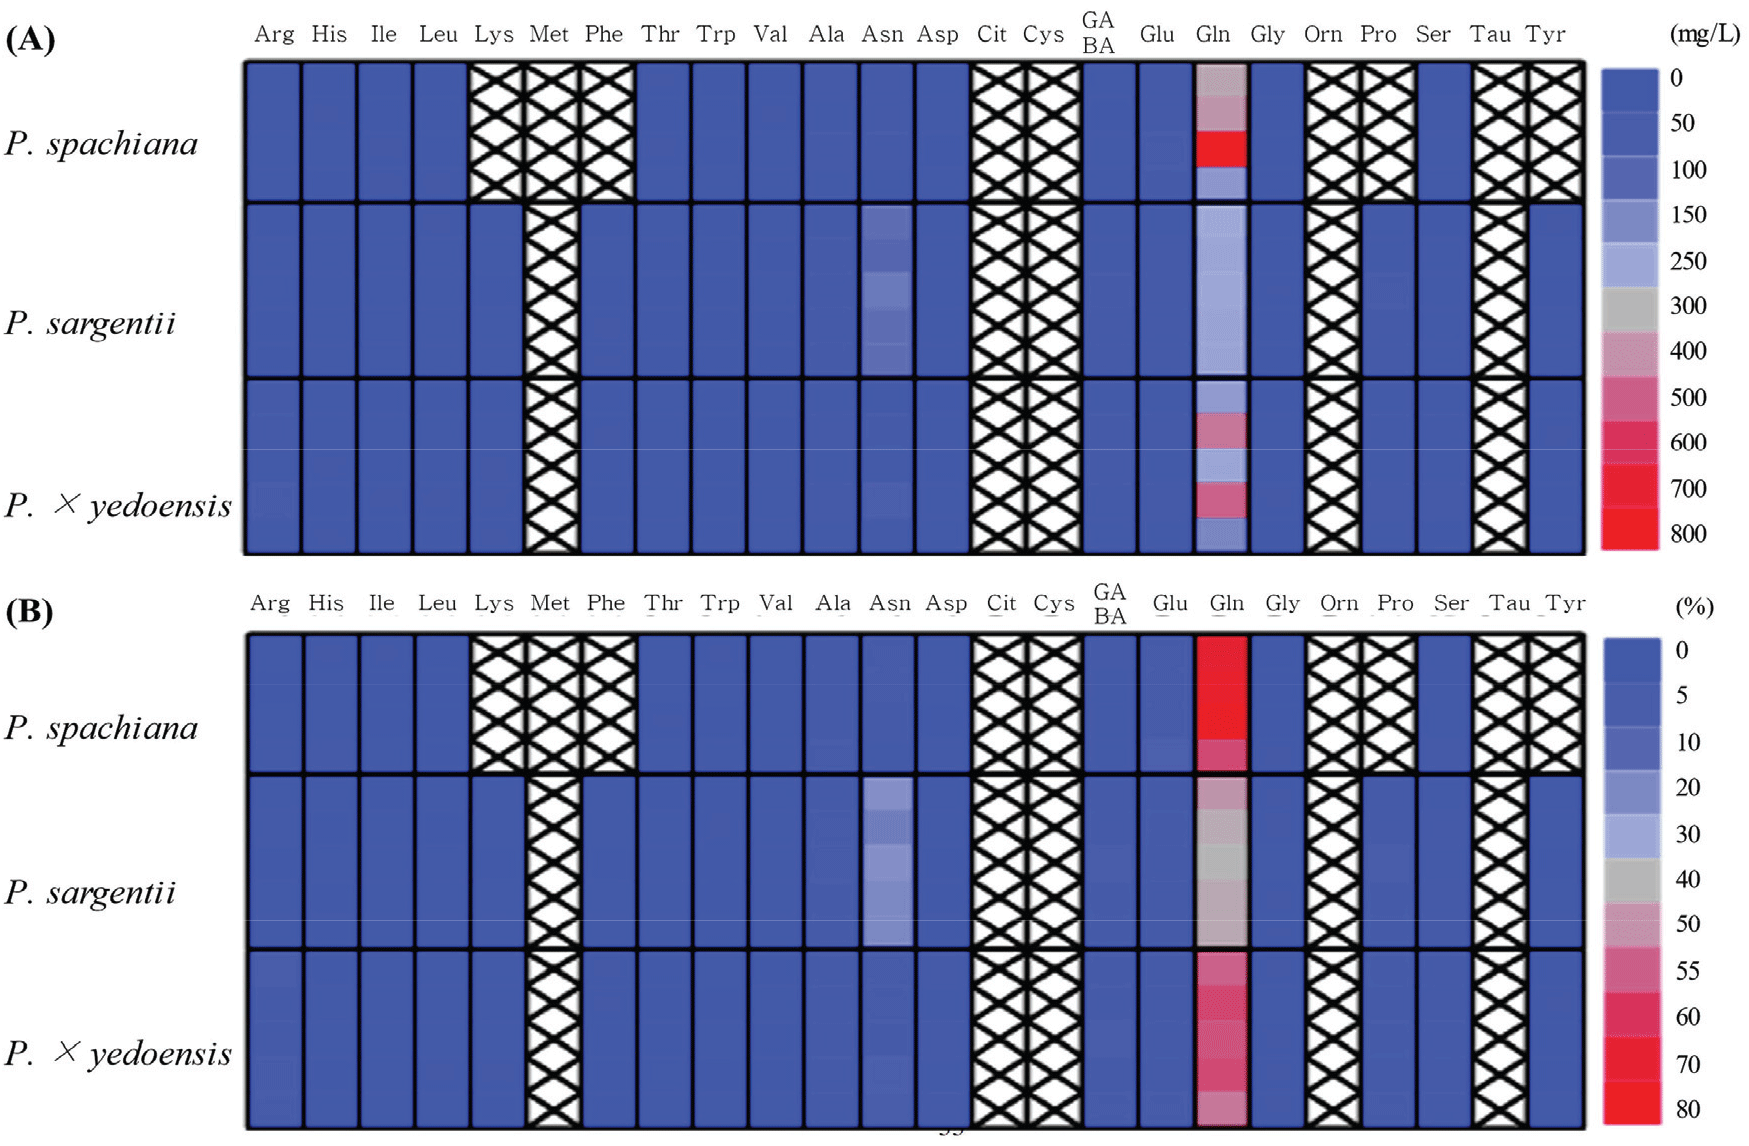
Glutamine was the most abundant amino acid across all three species, with the highest concentration observed in P. spachiana (481.8 ± 217.8 mg/L), where it constituted 70.3 ± 7.6% of the total amino acid content. In P. × yedoensis (375.2 ± 148.6 mg/L), glutamine made up 56.2 ± 3.6%, while P. sargentii (305.7 ± 9.2 mg/L) exhibited the lowest relative proportion of glutamine, accounting for 41.3 ± 2.4% of its total amino acids [Figure 6(B)].
While glutamine was the predominant amino acid, other amino acids also showed notable variation among the species. Alanine, asparagine, and glutamic acid were consistently detected at moderate levels, with P. sargentii displaying relatively high concentrations of alanine (35.3 ± 5.2 mg/L) and asparagine (168.9 ± 17.5 mg/L). In contrast, P. spachiana exhibited the highest glutamic acid concentration, with 39.5 ± 11.2 mg/L.
The presence of four amino acids (proline, phenylalanine, lysine, and tyrosine) was restricted to P. sargentii and P. × yedoensis, indicating potential differences in amino acid biosynthesis across species. Conversely, P. sargentii showed the highest concentrations of these amino acids, with 32.1 ± 3.4 mg/L of proline, 5.7 ± 1.0 mg/L of phenylalanine, 7.5 ± 2.3 mg/L of lysine, and 7.2 ± 3.5 mg/L of tyrosine.
Discussion
The morphological analysis of Prunus flowers revealed significant interspecific variations in floral structure, particularly in corolla size and hypanthium depth (Figures 2 and 3). P. × yedoensis and P. sargentii exhibited significantly larger corolla diameters, whereas P. spachiana was characterized by a smaller floral structure. Corolla size and hypanthium depth are known to influence nectar accessibility and pollinator preferences, as larger flowers with deeper nectaries are more accessible to pollinators like honeybees (A. mellifera) and bumblebees (Bombus spp.) (Nicolson and Thornburg, 2007).
The findings suggest that P. × yedoensis and P. sargentii may preferentially attract larger-bodied pollinators that can access deep-seated nectar, whereas P. spachiana, with its relatively shallow hypanthium, may be more suited for smaller pollinators with shorter tongue lengths. This aligns with earlier studies demonstrating that floral dimensions directly impact pollinator visitation rates and pollinator species specificity (Kim et al., 2019; Nicolson and Thornburg, 2007).
Additionally, bumblebees have been reported to prefer flowers with larger openings and extended nectar spurs, which supports the likelihood that P. × yedoensis and P. sargentii attract a broader range of generalist pollinators (Nicolson and Thornburg, 2007). The variations in hypanthium structure among the three species underscore the importance of floral morphology in pollinator selectivity, as nectar accessibility is a key determinant of pollination success (Brzosko et al., 2021). Studies have also indicated that environmental factors such as temperature fluctuations and sunlight exposure during flower development can significantly affect corolla size and shape (Heide, 2008). This may influence seasonal variations in pollinator visitation patterns, especially in climate-sensitive species like Prunus.
The Prunus species-specific patterns revealed distinct differences in nectar composition and honey production (Table 1, Figures 4 and 5). Across all three Prunus species, sucrose was the dominant sugar, suggesting potential selective pressures favoring sucrose-rich nectar, which has been shown to attract pollinators like honeybees that rely on sucrose for efficient foraging (Nicolson and Thornburg, 2007; Pacini and Nepi, 2007). Among the species studied, P. × yedoensis exhibited the highest SH ratio, indicating a potential adaptive mechanism for maximizing pollinator attraction through increased nectar rewards per flower. Honeybees have demonstrated a preference for high SH ratios due to the increased energy return per unit of foraging effort (Tiedge and Lohaus, 2017).
Nectar volume also varied significantly between species. While P. × yedoensis had the highest per flower, P. spachiana exhibited the highest floral abundance, with over 1.3 million flowers per tree. This high floral abundance compensated for its moderate per-flower nectar production, resulting in the greatest estimated honey yield per hectare. Previous research supports this finding, as floral abundance has been shown to enhance pollinator foraging efficiency by providing consistent, abundant nectar sources (Chung and Kim, 2014, Na et al., 2024). The relationship between nectar volume, sugar concentration, and honey yield aligns with previous studies, which have reported that species with high floral abundant and moderate nectar production can surpass species with superior nectar traits in overall honey yield (Strzałkowska-Abramek et al., 2019).
These findings emphasize the potential economic value of P. spachiana in apiculture due to its high floral abundance and resulting high honey production. Future research should investigate the influence of environmental variables on nectar secretion to optimize floral resource management in both natural and agricultural landscapes.
The amino acid composition analysis identified 19 amino acids across the three Prunus species, with significant variation in concentration and distribution patterns. P. sargentii exhibited the highest total amino acid content, followed by P. spachiana and P. × yedoensis (Figure 6). The known role of amino acids in pollinator nutrition (Nicolson and Thornburg, 2007; Nepi, 2014) suggests that P. sargentii may provide greater nutritional benefits to foraging insects due to its higher amino acid content.
Glutamine was the most abundant amino acid in all three species, with the highest concentration observed in P. spachiana. P. × yedoensis and P. sargentii. Glutamine constituted 70.3% of the total amino acids in P. spachiana, 56.2% in P. × yedoensis, and 41.3% in P. sargentii. Glutamine’s role as a key nitrogen source for pollinators, particularly honeybees, has been extensively documented (Nicolson and Thornburg, 2007; Baude et al., 2016). In addition to glutamine, alanine, asparagine, and glutamic acid were detected at moderate levels across all species.
Notably, proline was present only in P. sargentii and P. × yedoensis, but not in P. spachiana. Proline is known to stimulate the feeding behavior of pollinators (especially bees) because it is involved in energy metabolism (Nicolson and Thornburg, 2007). The absence of proline in P. spachiana may suggest reduced attractiveness to certain pollinator species. There were also species-specific differences in the detection of phenylalanine, lysine, and tyrosine. None of these amino acids were detected in P. spachiana, while P. sargentii showed the highest concentrations. These results suggest that amino acid composition can significantly influence pollinator behavior and that different species may show distinct preferences for certain amino acids (Baude et al., 2016; Nicolson and Thornburg, 2007). Thus, the diverse amino acid profile of P. sargentii may attract a wider range of pollinators, including generalist and specialized species.
Conclusion
This study examined the nectar secretion, sugar content, amino acid composition, floral abundant, and honey production potential of three Prunus species (P. × yedoensis, P. sargentii, P. spachiana), identifying key differences in their suitability for pollination and apiculture. P. spachiana demonstrated the highest honey production potential due to its exceptionally high floral abundance, making it the most efficient species for large-scale honey production. P. × yedoensis exhibited the highest nectar sugar content, enhancing pollinator attraction and retention, while P. sargentii had the highest amino acid content, suggesting superior nutritional benefits for pollinators. These findings highlight the significant role of floral morphology, nectar chemistry, and environmental influences in shaping pollination success and honey yield. P. spachiana is recommended for honey production, whereas P. × yedoensis and P. sargentii are valuable for pollinator support and colony health. Understanding these nectar traits can aid in optimizing apiculture strategies and pollination management. Further research on long-term nectar secretion patterns, genetic variation, and pollinator interactions will enhance the sustainable use of Prunusspecies in apiculture and ecosystem conservation.