Article

잣나무 인공림의 1차 및 2차 간벌에 따른 입목생장 특성 분석

이대성1https://orcid.org/0000-0003-1586-9385, 정성훈2https://orcid.org/0000-0003-3457-5008, 최정기2,*https://orcid.org/0000-0001-8205-267X
Daesung Lee1https://orcid.org/0000-0003-1586-9385, Sunghoon Jung2https://orcid.org/0000-0003-3457-5008, Jungkee Choi2,*https://orcid.org/0000-0001-8205-267X
Author Information & Copyright
1핀란드 자연자원연구원
2강원대학교 산림과학부
1Natural Resources Institute Finland (Luke), Latokartanonkaari 9, 00790 Helsinki, Finland
2Division of Forest Science, Kangwon National University, Chuncheon 24341, Korea
*Corresponding Author : jungkee@kangwon.ac.kr

© Copyright 2022 Korean Society of Forest Science. This is an Open-Access article distributed under the terms of the Creative Commons Attribution Non-Commercial License (http://creativecommons.org/licenses/by-nc/4.0/) which permits unrestricted non-commercial use, distribution, and reproduction in any medium, provided the original work is properly cited.

Received: Jan 21, 2022; Revised: Mar 01, 2022; Accepted: Mar 02, 2022

Published Online: Mar 31, 2022

요약

본 연구는 잣나무(Pinus koraiensis Siebold & Zucc.) 인공림을 대상으로 1차 및 2차 간벌에 따른 입목의 생장특성을 규명하여 산림시업지침 및 매뉴얼 개발을 위한 기초자료를 제공하고자 수행되었다. 사용된 연구자료는 간벌강도에 따라 설치된 잣나무 인공림 영구고정표준지로부터 수집되었으며, 각 간벌시험림별 4~5회 반복조사된 자료를 토대로 임령 19~43년생 시기의 흉고직경, 재적, 고사목 등 주요 입목 및 임분 현황을 분석하였다. 간벌강도에 따른 일원분산분석에서 개체목의 흉고직경 및 재적 변화는 유의적인 차이를 보였으며(p<0.05), 특히 간벌강도가 클수록 시간이 경과함에 따라 경급분포는 더 오른쪽에 위치하여 입목의 경급이 더 큰 것으로 관측되었다. 흉고직경 정기평균생장량의 경우, 간벌강도가 강하고 간벌 후 경과기간이 짧을수록 생장량이 높았는데, 구체적으로 임령 19~24년생 때 간벌강도별 생장량 범위는 0.48~0.95 cm/year이었다. 이후 2차 간벌에 따른 정기평균생장량도 강도간벌구에서 더 큰 것으로 분석되었으며, 임령 37~42년생 때 간벌강도별 생장량 범위는 0.29~0.67 cm/year이었다. 개체목 재적의 정기평균생장량은 간벌강도에 따라 차이가 있었으며, 흉고직경과 달리 시간이 지나도 크게 줄어들지 않는 경향이 나타났다. 임분 재적은 전반적으로 임분밀도가 밀한 표준지에서 높은 경향이었으나, 임분재적 정기평균생장량은 시기에 따라 무간벌뿐만 아니라 약도간벌이 이루어진 임분에서 더 높은 것으로도 분석되었다. 고사목은 무간벌구에서 가장 많이 발생하였으며, 반복조사가 진행될수록 임분밀도에 따른 고사목 본수 차이는 더욱 증가하였다. 종합적으로 임분밀도가 밀할수록 개체목의 흉고직경과 재적 생장량은 낮아지는 경향이었으나, 적절한 1차 및 2차 간벌이 시행되면 생장량은 다시 촉진되었다.

Abstract

This study was conducted to provide basic information for the development of silvicultural guidelines and manuals. This was achieved through analysis of tree and stand characteristics according to the first and second thinning in Korean white pine plantations. Data were collected from permanent plots installed at Korean white pine plantations according to thinning intensity, and residual tree and stand variables, including diameter at breast height (DBH), volume, and mortality at age 19–43, were analyzed using data repeatedly collected in 4-5 measurements by experiments. According to one-way variance of analysis, tree DBH and volume were significantly different according to thinning intensity (p<0.05). DBH distribution was skewed to the left side over time as thinning intensity was heavier. Thus, tree DBH values were larger in heavy thinning plots with increased age. The periodic annual increment (PAI) of DBH was higher with heavier thinning intensity and fewer years after thinning. The PAI range by thinning intensity was 0.48–0.95 cm/year at age 19–24. In addition, the PAI increased in heavy thinning plots after the second thinning; The PAI range by thinning intensity was 0.29–0.67 cm/year after the second thinning at age 37–42. The PAI of tree volume differed according to thinning intensity, and the PAI value did not decrease obviously, in contrast to the pattern of the DBH PAI. Stand volume was generally higher in high-density stands, and the PAI of stand volume was high in unthinned and light thinning plots. Mortality was highest in unthinned plots, and the differences in mortality according to thinning intensity increased over time. Consequently, the growth of DBH and tree volume was lower as stand density increased, but this growth was facilitated with appropriate first and second thinning operations.

Keywords: Pinus koraiensis Siebold & Zucc.; diameter at breast height (DBH); volume; periodic annual increment; thinning intensity; mortality

서 론

잣나무(Pinus koraiensis Siebold & Zucc.)는 목재 및 종자생산 등으로 활용되는 주요 경제수종으로 국내 침엽수림 면적 2,319,832 ha의 7.3%인 151,946 ha의 산림면적을 차지하고 있다(Korea Forest Research Institute, 2012a; Korea Forest Service, 2021a). 또한, 잣나무림 대부분이 인공림으로 조성되어 있으며, 최근 5년간 연평균 조림면적은 409 ha로써 인공림의 효율적인 산림경영이 요구되고 있다(Korea Forest Service, 2021a). 이를 위해 다양한 산림시업이 이루어지고 있으며, 인공림 경영을 위한 대표적인 무육 방법으로 간벌이 실시되고 있다(Korea Forest Research Institute, 2005).

일반적으로 솎아베기로도 명명되는 간벌은 주벌수확 이전 기간에 개체목들의 생육공간에 대한 경쟁을 줄이기 위한 벌채를 의미하며(Lee et al., 2010), 잔존목의 흉고직경 생장을 촉진하고, 자연고사를 예방하여 임분건전성을 향상시키는 것으로 알려져 있다(Rantala, 2011; Choi et al., 2014a; Korea Forest Research Institute, 2015). 특히, 목재생산림으로 관리되는 인공림에서는 주로 형질이 우수한 우량대경재 생산을 목표로 간벌이 실시되고 있다(Smith, 1986; Nyland, 1996; Korea Forest Research Institute, 2005; 2015).

산림청 임업통계연보에 따르면, 큰나무가꾸기로 분류된 간벌은 최근 5년간 연평균 78,446 ha의 산림면적에 시행되었다(Korea Forest Service, 2021a). 또한, 산림청 2021년 세출예산 총 33,065억 원 중 7.5%인 1,884억 원에 해당하는 예산을 편성하여 산림청 단일 사업 분야로 가장 큰 금액이 지속적으로 배정되고 있다(Korea Forest Service, 2021b). 이처럼 많은 숲가꾸기 면적과 지출예산에도 불구하고 아직까지 간벌에 대한 정량적인 효과는 학술적으로 충분히 증명되지 않았으며, 동적생장에 따른 모델이나 시업지침은 여전히 부족한 상황이다.

첫 간벌이 진행된 후 추가적으로 시행하는 2차 간벌은 국내에서 주로 수익간벌로 알려져 있는데, 임업선진국에서는 이미 각 국가의 주요 경제수종을 대상으로 2차 간벌에 따른 입목생장 효과가 규명되고 있다(Knoebel et al., 1986; Hynynen et al., 2002; Amateis and Burkhart, 2005; Nishizono et al., 2008; Bergh et al., 2014; Rytter and Stener, 2014; Hynynen et al., 2019). 특히, 동일 기간 내 흉고직경과 재적 생장을 촉진하여 최종 수확 시 양질의 우량대경재 생산을 위한 연구가 활발히 진행되고 있다(Hynynen, 1995; Amateis, 2000; Huuskonen and Hynynen 2006; Pfister et al., 2007; Wallentin and Nilsson, 2011; Huuskonen et al., 2014; Niemisto et al., 2018).

하지만 국내에서는 간벌강도가 생장에 미치는 영향에 대하여 연구가 진행되었으나, 모두 1회 간벌과 같은 단기간의 결과 위주로 보고되었다(Hwang et al., 2008; Bae et al., 2010; Choi et al., 2014a; Lee et al., 2017a; Park, 2017). 이에 따라 2차 간벌 이상 실시되고 있는 현실 임분을 이해하는데 기초자료는 여전히 부족하며(Jung, 2022), 임분의 효율적인 산림관리를 위해 1차 및 2차 간벌을 통한 생장변화 모니터링 연구가 지속적으로 필요한 실정이다.

따라서 본 연구는 잣나무 간벌시험림을 대상으로 반복측정된 모니터링 자료를 활용하여 입목 및 임분의 생장변화를 파악하고자 수행되었다. 구체적으로 1차 및 2차 간벌강도에 따른 입목들의 시계열적 생장변화 파악, 흉고직경과 재적의 정기평균생장량 분석, 임분제원 및 고사목 분석을 통해 간벌시업을 위한 기초자료를 제공하고자 하였다.

재료 및 방법

1. 연구대상지

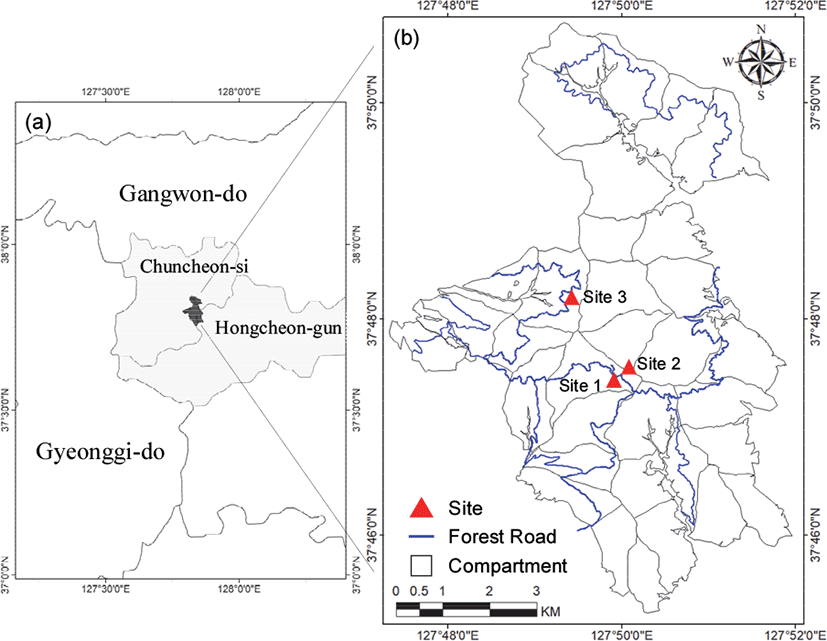
본 연구대상지는 강원대학교 학술림 내 간벌강도에 따라 시업처리 후 모니터링 되고 있는 잣나무 인공림이며, 행정구역상 강원도 춘천시 동산면 봉명리와 원창리에 위치하고 있다(Figure 1). 연구대상지인 강원대학교 학술림의 전체 산림면적 3,140 ha 중 750 ha가 인공림으로 구성되어 있는데, 그 중 521 ha(69%)가 잣나무 조림지로써 인공림 면적의 대부분을 차지하고 있다(Kangwon National University, 2020). 토양은 대부분 양토 및 사질양토로 이루어져 있고, 낙엽분해산물과 광물질이 혼합되어 유기질이 풍부하여 식물생육에 적합하다(Choi, 2003). 기상청에서 발표한 춘천지역 과거 1991~2020 30년간 연별평년값 통계에 따르면, 평균기온 11.4°C, 최고 17.4°C, 최저 6.3°C, 강수량 1,341.5 mm이었다(Korea Meteorological Administration, 2021).
jksfs-111-1-150-g1
Figure 1. Map of the study area in research forest of Kangwon National University, Chuncheon-si, Gangwon-do, South Korea. The plot (a) presents the location of research forest, and plot (b) displays the location of thinning experimental sites for Korean white pine plantation in the research forest.
Download Original Figure
2. 간벌시업처리 및 표준지 설계

본 연구에 사용된 잣나무 간벌시험림은 총 3지역이며, 각 시험림은 강도간벌, 중도간벌, 약도간벌, 무간벌 설계에 따라 4개의 시험구로 구성되어 있다(Table 1). 제1, 2간벌시험림은 1996년에 20 m × 20 m 정방형 크기의 표준지가 임도를 사이에 두고 설치되었으며(Choi et al., 1996), 제3간벌시험림은 1999년 30 m × 30 m 정방형 크기로 표준지간 완충지역을 고려하여 4개의 시험구가 설치되었다(Choi et al., 1999). 그 중 제1, 2간벌시험림은 1996년도 19년생 때 표준지가 설치되면서 1차 간벌이, 이후 2014년 37년생 때 2차 간벌이 실시되었다(Choi et al., 2014b; 2019). 제3간벌시험림은 1999년도 21년생 때 1차 간벌이, 이후 2016년 38년생 때 2차 간벌이 실시되었다(Choi et al., 2021).

Table 1. General description and site characteristics for thinning experimental sites of Korean white pine plantation.
Thinning experimental site Experiment area (ha) Plot area (ha) Established year Stand age (year) Annual mean temperature (°C) Annual mean precipitation (mm) Soil moisture Soil texture Aspect (°) Slope (°) Elevation (m) Site indexa) (m) Locationb)
First measurement Last measurement
Site 1 0.16 0.04 1996 19 42 11.4 (6.3~17.4) 1,341.5 Moderate Loam 213~232 18~28 622~630 14 N: 37°47′25″
E: 127°50′02″
Site 2 0.16 0.04 1996 19 42 233~260 12~26 645~661 14 N: 37°47′27″
E: 127°50′03″
Site 3 0.36 0.09 1999 21 43 194~256 26~28 600~612 16 N: 37°48′07″
E: 127°49′24″

a) Site index of Korean white pine plantations was computed based on base age and dominant height according to the site index table provided by Korea Forest Research Institute (2012b).

b) The coordinate system of location is WGS 84 Web Mercator.

Download Excel Table

각 시험림의 1차 간벌과 2차 간벌 시업은 우량대경재로 생산될 미래목이 존치할 수 있도록 입목 간 거리, 수형급 등의 정성 및 정량을 고려한 하층간벌이 실시되었다(Choi et al., 1996; 1999; 2019; 2021). 특히 2차 간벌시업은 1차 간벌에 따라 임분밀도가 밀한 시험구에 강도로 벌채를 실시하도록 설계되었다(Table 2). 2차 간벌에서 제1, 2간벌시험림은 무간벌구가 유지되었으며, 제3간벌시험림은 무간벌구를 포함하여 간벌시업이 진행되었다. 해당 시업결과를 간벌목의 평균 흉고직경/간벌 전 전체 입목의 평균 흉고직경으로 나눈 비(Thinning quotient)로 살펴본 결과, 1차 간벌 시 0.66~0.88, 2차 간벌 시 0.70~0.87의 범위로 산출되었다(Table 2). 이는 1.00보다 낮은 수치로써 적절한 하층간벌이 시행된 것으로 분석되었다.

Table 2. Thinning intensity of first and second thinning by experimental site in Korean white pine plantation.
Thinning experimental site Plot First thinning Second thinning Thinning intensity class (1st → 2nd)
No. of trees before thinning (trees/ha) Thinning intensity (%) No. of trees after thinning (trees/ha) Thinning quotient No. of trees before thinning (trees/ha) Thinning intensity (%) No. of trees after thinning (trees/ha) Thinning quotient
Stem number basis Basal area basis Stem number basis Basal area basis
Site 1 A 2944 68 50 946 0.86 920 17 8 762 0.70 Heavy → Light
B 2972 57 38 1285 0.82 1259 45 30 696 0.82 Moderate → Moderate
C 2901 43 21 1642 0.70 1423 67 50 465 0.87 Light → Heavy
D 2831 0 0 2831 0 1897 0 0 1897 0 Unthinned → Unthinned
Site 2 A 2786 56 38 1227 0.83 1201 28 14 869 0.80 Heavy → Light
B 2745 43 26 1569 0.78 1333 41 30 784 0.84 Moderate → Moderate
C 3240 40 28 1928 0.83 1848 64 50 669 0.87 Light → Heavy
D 3087 0 0 3087 0 1752 0 0 1752 0 Unthinned → Unthinned
Site 3 A 1595 61 48 618 0.88 618 0 0 618 0 Heavy → Unthinned
B 1879 43 23 1063 0.73 1026 11 9 915 0.82 Moderate → Light
C 1683 18 8 1471 0.66 1185 29 23 836 0.73 Light → Moderate
D 1787 0 0 1787 0 1170 34 29 768 0.76 Unthinned → Heavy

Note: For site 1 and 2, first thinning was operated in 1996 at age 19 and second thinning in 2014 at age 37. For site 3, first thinning was operated in 1999 at age 21 and second thinning in 2016 at age 38. The number of trees before and after thinning was computed based on the whole plot size (e.g., 20 m × 20 m or 30 m × 30 m) by plot of each experimental site. Thinning quotient is the quotient between the mean diameter of removed trees and the mean diameter of all trees before thinning. Thinning intensity class was named independently by experimental sites based on the thinning intensity and the number of trees after thinning to easily explain illustrative results in this study.

Download Excel Table
3. 조사인자 및 측정방법

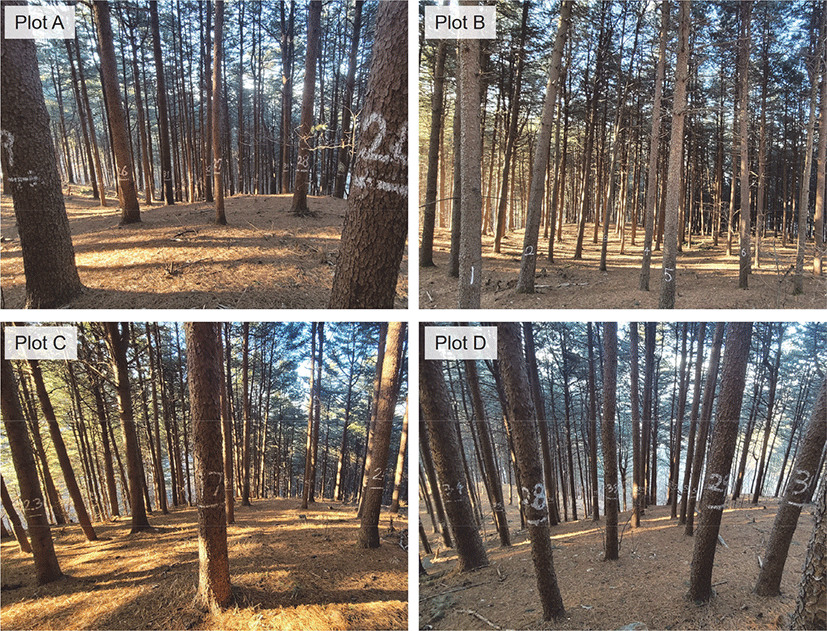
간벌강도에 따른 입목의 생장변화를 분석하기 위한 현장의 매목조사는 시험림에 따라 4~5회 실시하였다. 제1, 2간벌시험림은 1차 간벌이 실시된 1996년에 1차 매목조사를 시작으로 2001년, 2008년, 2014년(2차 간벌), 2019년 총 5회의 매목조사를 실시하였고, 제3간벌시험림은 1차 간벌이 실시된 1999년 1차 매목조사를 시작으로 2010년, 2016년(2차 간벌), 2021년 총 4회의 매목조사를 실시하였다(Choi et al., 1996; 1999; 2001; 2010; 2014b; 2016; 2019; 2021). 현재 각 간벌시험림은 경계부 말뚝과 입목라벨링을 이용하여 보존되고 있으며, 간벌강도에 따른 생장연구 및 차기 현장조사를 위하여 지속적으로 관리되고 있다(Figure 2).
jksfs-111-1-150-g2
Figure 2. Photos of thinning experimental site 1 in Korean white pine plantation as an example.
Download Original Figure

각 표준지의 측정인자로써 수종, 흉고직경, 수고, 지하고, 수관폭, 수간형질 및 수관급, 입목위치, 고사여부와 같은 다양한 입목인자와 경사 및 사면방향을 포함한 지황인자를 수집하였다. 그 중 본 연구에 이용된 입목측정인자로써 흉고직경은 D-tape를 이용하여 경사 위쪽에서 입목 지상 1.2 m 높이의 직경을 측정하였고, 수고는 Haglof사 Vertax-Ⅳ를 통해 입목의 초두부까지의 높이를 측정하였다(Choi et al., 2009; 2010; 2014; 2015). 경사 및 사면방향은 Suunto사 클리노미터(Clinometer)를 이용하여 경사지 방향에 따라 측정하였다.

4. 산림생장 모니터링 분석방법

본 연구는 간벌강도별 생장모니터링 비교·분석을 위해 수행됨에 따라, 시험구간 완충구역이 없어 간벌효과가 중첩되는 입목을 제외시키고자 하였다. 이를 위해 제1, 2간벌시험림 표준지의 경우 당초 시험구의 크기, 입목생육상태, 존치된 잔존입목수를 고려하여 시험구마다 상·하·좌·우 2 m씩 완충구역이 설정되었다. 따라서 각 시험구 경계부에 위치한 입목들이 제외되었으며, 각 표준지의 16 m × 16 m 내 포함되는 입목을 대상으로 최종분석을 진행하 였다(Jung, 2022). 최종적으로 분석에 사용된 2차 간벌 후 입목 수는 제1시험림 11~49본, 제2시험림 18~36본이었다. 제3시험림은 설치 당시 표준지간 완충구역이 7~40 m로 존재함에 따라, 분석 시 추가적인 완충구역을 설정하지 않았다. 따라서 30 m × 30 m의 표준지 내 전체 본수에 대하여 분석이 진행되었으며, 2차 간벌 후 사용된 입목 수는 50~74본이었다.

본 연구를 위해 현장에서 수집된 측정인자를 기반으로 입목 및 임분 단위의 추가변수들이 산출되었다. 흉고단면적(BA)은 아래 식 1과 같이 산출하였으며, 개체목의 입목재적(V)은 Lee et al.(2017b)의 연구에서 보고된 이변수 재적식 중 적합성이 가장 높은 모델의 파라미터를 적용하여 식 2와 같이 계산하였다. 산출된 변수 중 단위면적당 흉고단면적 및 재적과 같은 임분제원을 산출하기 위하여 각 표준지 내 결과 값은 ha당 수치로 환산되었다.

B A = π × ( 1 ( m ) 100 ( cm ) ) 2 × ( D 2 ) 2
(1)
V = 0.01097 + 0.00003772 D 2 H
(2)

BA: Tree basal area (m2), D: Tree diameter at breast height (cm),

π: mathematical constant approximately equal to 3.14159,

V: Tree volume (m3), H: Tree height (m).

간벌시험림별 측정시기마다 조사간격은 다소간 상이하였지만, 정기평균생장량 산출법을 이용하여 측정시기 사이의 생장량을 아래 식 3과 같이 적용·산출하였다(Burkhart et al., 2019). 이에 따른 정기평균생장량 값을 활용하여 간벌강도 및 생장기간별 효과를 비교·분석하였다.

P A I = Y 2 Y 1 T
(3)

PAI = Periodic annual increment of DBH (cm/year), tree volume (m3/year), or stand volume (m3·ha−1·year−1)

Y2 = DBH, tree volume, or stand volume at end of growth period

Y1 = DBH, tree volume, or stand volume at start of growth period

T = number of years in growth period

본 연구에서는 간벌강도에 따른 흉고직경 및 재적의 주요 생장변화를 대상으로 일원배치 분산분석(One-way ANOVA) 및 Duncan의 다중비교검정(alpha=0.05) 방법을 사용하여 시험구간 유의적인 생장차이를 분석하였다. 산점도의 생장패턴 분석 시 이해를 돕기 위해 적은 표본 수이지만 단순선형회귀분석을 사용하였으며, 본 연구의 모든 통계적 검정은 R통계소프트웨어를 이용하여 진행되었다(R Core Team, 2019).

결과 및 고찰

1. 조사시기별 임분제원현황

본 시험림들에 적용된 간벌률은 시험구별 입목본수 기준 1차 간벌 18%~68%, 2차 간벌 11%~67% 범위였으며, 흉고단면적 기준 간벌률도 시업강도에 따라 다양하였다(Table 2). 국내외 간벌 연구가 입목본수 기준뿐만 아니라 흉고단면적 및 재적 기준 간벌률을 시행하는 것으로 보고되고 있어 향후 다양한 기준 간벌률에 대한 연구가 필요하다고 판단된다(Mäkinen and Isomäki, 2004a; 2004b; Lee and Choi, 2019; 2020). 본 연구의 최종 조사시기 잔존 입목본수는 잣나무림 제1시험지 657~2,035 본/ha, 제2시험지 758~1,347 본/ha, 제3시험지 618~915 본/ha으로 간벌강도에 따라 다양하였다(Table 3). 표준지 설치 후 생장변화와 임분제원현황도 간벌강도 및 조사시기에 따라 상이하였다.

Table 3. Summary statistics of tree and stand characteristics for Korean white pine plantation by each plot of experimental sites.
Site Plot At measurement after 1st thinning At the measurement after 2nd thinning At the last measurement
Average tree DBH (cm) Average tree height (m) Average tree volume (m3) No. of stems (trees/ha) Stand basal area (m2/ha) Stand volume (m3/ha) Average tree DBH (cm) Average tree height (m) Average tree volume (m3) No. of stems (trees/ha) Stand basal area (m2/ha) Stand volume (m3/ha) Average tree DBH (cm) Average tree height (m) Average tree volume (m3) No. of stems (trees/ha) Stand basal area (m2/ha) Stand volume (m3/ha)
1 A 13.5 9.2 0.078 863 12.7 67.0 25.4 16.1 0.416 657 34.2 273.3 27.4 17.1 0.513 657 39.9 337.2
B 13.6 9.3 0.081 1548 23.5 124.9 24.4 16.0 0.385 879 42.1 338.4 26.9 16.8 0.489 879 51.3 430.0
C 13.9 9.0 0.081 1539 24.4 125.2 26.5 15.7 0.434 470 26.4 204.3 29.8 16.6 0.580 470 33.5 272.6
D 12.2 8.7 0.065 2566 31.7 165.8 19.1 14.4 0.230 2124 65.2 487.9 20.8 15.1 0.285 2035 74.5 579.2
2 A 12.9 9.7 0.074 1118 14.9 82.9 22.1 16.0 0.317 958 37.8 303.7 24.3 17.0 0.410 919 44.2 376.3
B 13.1 9.4 0.077 1475 20.9 113.1 22.7 15.9 0.326 758 31.3 247.2 25.8 16.6 0.438 758 40.4 331.9
C 12.8 9.4 0.073 2008 26.9 147.2 22.2 15.5 0.305 837 32.8 255.4 25.4 16.5 0.422 795 40.8 335.8
D 13.3 9.4 0.078 1999 28.9 156.4 19.3 14.7 0.240 1565 49.6 365.8 21.9 15.8 0.325 1347 54.1 423.7
3 A 19.2 12.0 0.190 618 18.6 117.5 28.8 16.9 0.564 618 41.4 348.4 30.7 17.7 0.667 618 47.0 412.5
B 16.6 10.3 0.127 1063 24.1 134.9 24.7 15.8 0.394 915 45.7 360.1 26.4 17.3 0.495 915 52.5 453.1
C 16.3 12.9 0.169 1471 33.4 248.3 25.5 18.1 0.484 836 44.9 398.2 27.9 19.4 0.625 836 54.1 522.6
D 15.8 12.9 0.160 1787 38.2 285.1 24.0 17.3 0.407 768 36.3 312.7 25.9 18.6 0.511 768 42.4 392.5

Note: Stand age and thinning intensity were provided in Table 1 and 2. The measurement after 1st thinning was carried out in 1996 for site 1 and 2 (age 19) and 1999 for site 3 (age 21). The measurement after 2nd thinning was carried out in 2014 for site 1 and 2 (age 37) and 2016 for site 3 (age 38). The last measurement was carried out in 2019 for site 1 and 2 (age 42) and 2021 for site 3 (age 43). The tree- and stand-level statistics were computed based on the plot size applied with the buffer zone (e.g., 16 m × 16 m or 30 m × 30 m) by plot of each experimental site.

Download Excel Table

1차 간벌 직후부터 2차 간벌시기까지의 평균 흉고직경 변화를 비교하면, 간벌구의 생장량은 무간벌구에 대비하여 높게 나타났다. 또한, 2차 간벌 직후부터 최종 측정시기 사이의 평균 흉고직경도 강도간벌구에서 더욱 높았다. 한편, 흉고직경과 달리 평균 수고는 ANOVA분석에서 간벌강도에 따른 유의적인 차이 및 경향이 나타나지 않았다. 해당 결과는 선행연구의 결과와 일치하였으며, 수고생장은 직경생장보다 임분밀도에 독립적이기 때문이라고 사료된다(Mäkinen and Isomäki, 2004a; 2004b). 개체목 재적은 간벌강도에 따라 증가하는 경향이었으나, 임분 흉고단면적과 재적은 무간벌구와 같이 임분밀도가 높은 표준지에서 가장 높았다. 국립산림과학원에서 관리하는 임분밀도 및 임령이 유사한 잣나무 간벌시험림과 비교하면, 본 연구대상지의 전반적인 생장현황은 유사하거나 다소 우세하였다(National Institute of Forest Science, 2021). 다만, 본 연구대상지가 잣나무 생육에 비교적 유리한 조건임을 참고하여(Choi, 2003), 후속연구에서는 다양한 지역으로부터의 간벌효과를 분석하여 토양, 기후, 임지생산성과 같은 특성이 고려된 시업지침을 마련해야 할 것으로 사료된다(Hynynen et al., 2002; Mäkinen and Isomäki, 2004b; Lee and Choi, 2014).

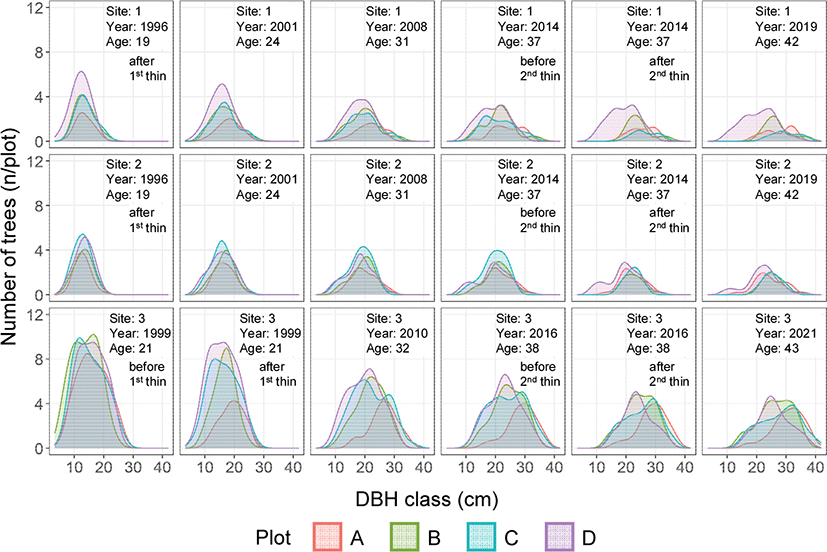
시험림별 경급분포의 시계열적 변화를 분석한 결과, 간벌강도가 클수록 평균경급이 커지는 경향이 관측되었다(Figure 3). 제1, 2간벌시험림의 경우, 19년생 때에는 간벌구간 경급분포의 차이가 없었으나, 이후 24년생, 31년생, 37년생까지 임령이 증가함에 따라 간벌강도별 경급분포의 차이가 존재하였다. 2차 간벌 시기에도 Plot D가 무간벌구로 지속됨에 따른 열세목 및 피압목의 경급은 명료히 낮게 분포하였다. 제3간벌시험림의 경우도, 21년생 때에는 간벌구간 경급분포의 차이가 없었으나, 이후 간벌강도에 따른 차이가 32년생과 38년생 때 관측되었다. 이후 잔존 임분밀도에 따라 2차 간벌이 실시되어, 43년생 때 간벌구간 경급분포의 차이는 다소 완화되었다.
jksfs-111-1-150-g3
Figure 3. DBH distribution by thinning intensity over measurement instances in each experimental site of Korean white pine plantation. DBH class was 2 cm of bandwidth. Each experimental site and plot was thinned as shown in the legend from heavy thinning treatment to light thinning treatment based on first and second thinning intensity. Specific thinning treatments were performed according to Table 2.
Download Original Figure

간벌강도가 클수록 시간이 경과함에 따라 경급이 큰 입목들이 더 많이 관측되었다(Figure 3). 따라서 간벌을 통해 임분밀도에 따른 입목 간 경쟁이 완화되면 임령이 증가하면서 잔존입목들의 평균경급은 더 큰 것으로 분석되었다. 이와 같이 흉고직경 생장촉진과 대경재 생산에 있어 간벌이 효과적인 것은 선행연구의 결과와 일치하였다(Hynynen et al., 2002; Mäkinen and Isomäki, 2004a; 2004b; Bergh et al., 2014; Rytter and Stener, 2014; Niemisto et al., 2018; Fahlvik et al., 2021). 따라서 적정 간벌강도 및 시기는 우량대경재 생산을 위한 주요 인자로써 적정 산림시업 시 더욱 경제적이고 효율적인 산림관리가 가능할 것이라 판단된다.

2. 흉고직경 생장변화

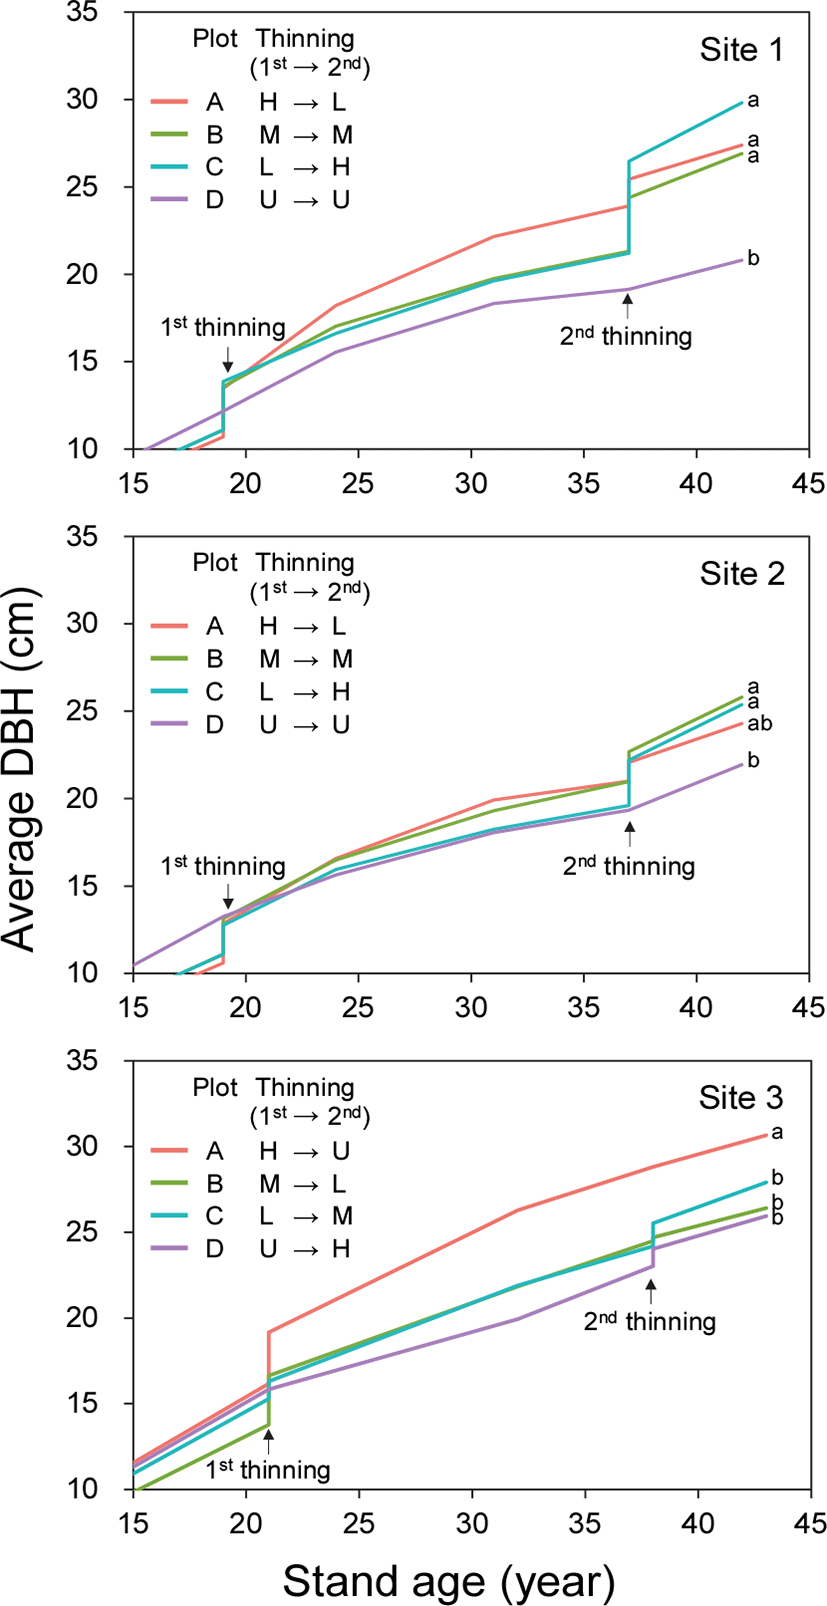
전체 생장기간에 대한 평균 흉고직경의 변화를 파악한 결과, 조사시기마다 간벌강도별 생장차이가 확인되었다. 간벌구별 흉고직경 범위는 제1시험림에서 19년생 때 12.2~13.9 cm에서 42년생 때 20.8~29.8 cm로, 제2시험림에서 19년생 때 12.8~13.3 cm에서 42년생 때 21.9~25.8 cm로, 제3시험림에서 21년생 때 15.8~19.2 cm에서 43년생 때 25.9~30.7 cm로 변화하였다(Figure 4). 지속가능한 산림자원관리 매뉴얼의 솎아베기 후 35년생, 400 본/ha, 목표 흉고직경 21 cm와 비교하였을 때, 본 연구의 흉고직경 생장이 다소 우세한 것으로 파악되었다(Korea Forest Research Institute, 2005).
jksfs-111-1-150-g4
Figure 4. Growth change of average DBH by thinning intensity in each experimental site of Korean white pine plantation. Thinning represents the thinning intensity from first thinning to second thinning. The thinning symbols are the acronyms for thinning intensity; H is heavy thinning, M is moderate thinning, L is light thinning, U is un-thinning. Specific thinning treatments were performed according to Table 2. Significant differences between thinning treatments at the final measurement are indicated by different letters based on Duncan’s multiple range test (alpha=0.05).
Download Original Figure

전반적으로 시간이 경과함에 따라 간벌강도간 평균 흉고직경 차이는 증가하였으며, 특히 무간벌구와 강도간벌구의 흉고직경 차이가 가장 크게 나타났다. 예를 들어 제1시험림의 경우 두 간벌구간 평균 흉고직경의 차이는 19년생 때(1차 간벌 직후) 1.7 cm에서 37년생 때(2차 간벌 직전) 4.8 cm로, 37년생 때(2차 간벌 직후) 7.3 cm에서 42년생 때 9.0 cm로 증가하였다. 이러한 생장차이에 대해 ANOVA분석을 실시한 결과, 제1, 2 간벌시험림의 경우 1차 간벌 후 12년이 경과된 31년생부터, 제3 간벌시험림에서는 1차 간벌 후 11년이 경과된 32년생부터 간벌구간 평균 흉고직경의 차이가 유의적으로 나타났다(p<0.05).

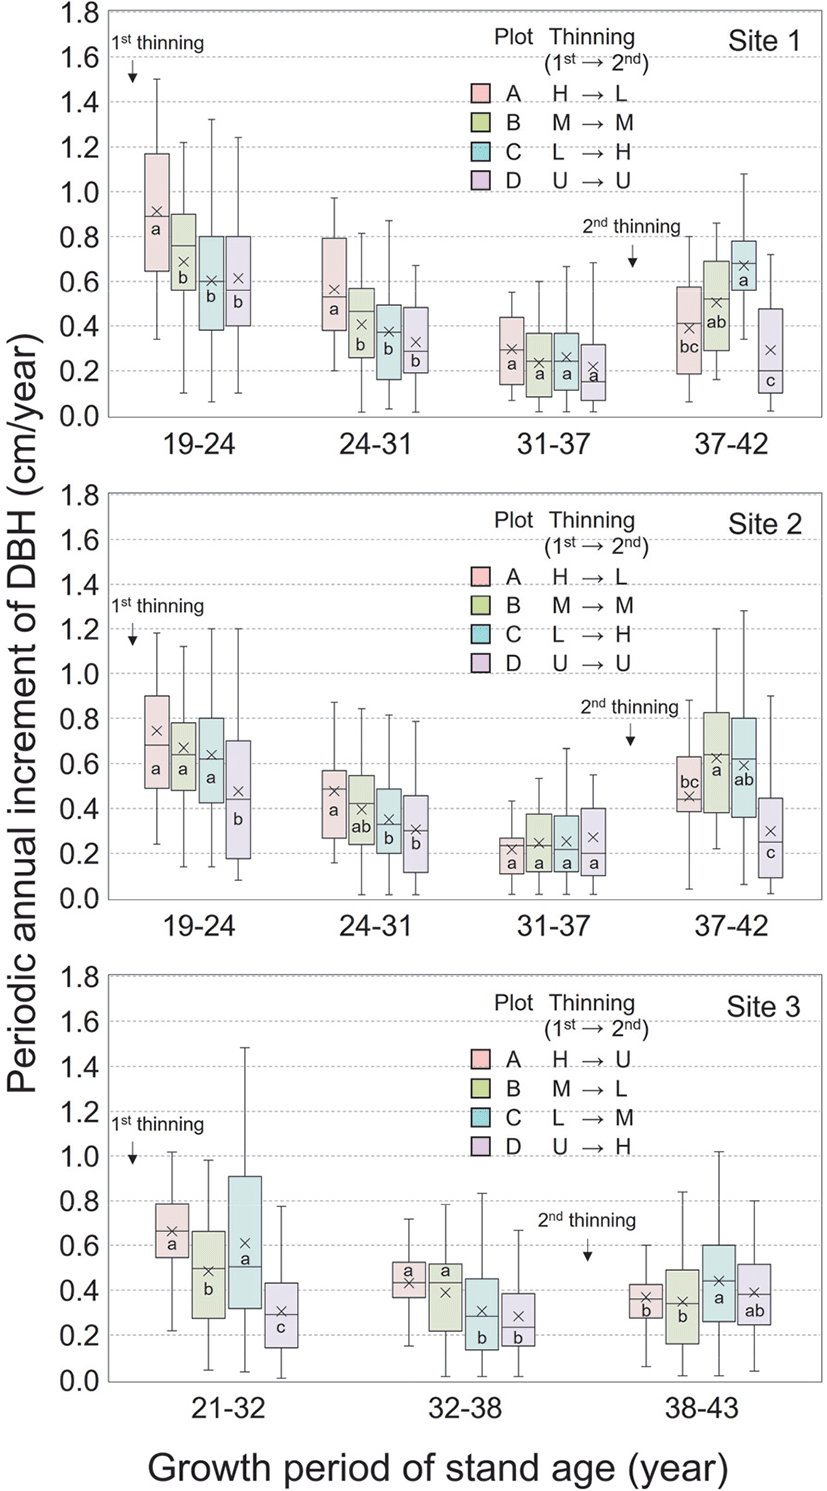
흉고직경 정기평균생장량 차이는 간벌강도, 간벌 후 잔존본수, 조사시기 경과에 따라 뚜렷이 구분되었으며, 간벌 직후 초기 생장기간에는 강도간벌구의 생장량이 무간벌구에 비해 높았다(Figure 5). 첫 생장기간 동안 흉고직경 정기평균생장량의 간벌구별 평균 범위는 제1간벌시험림에서 0.60~0.91 cm/year, 제2간벌시험림에서 0.48~0.74 cm/year, 제3간벌시험림에서 0.31~0.66 cm/year이었다. 이후 시간 경과에 따라 전체적으로 생장량이 감소하였고, 간벌구간 생장량의 차이도 줄어드는 경향이 나타났다(Figure 5). 특히, 2차 간벌 실시 직전, 간벌구간 생장량 차이는 가장 작았다. 해당 시기 간벌구간 생장량 범위는 제1시험림 31-37년생 때 0.22~0.30 cm/year, 제2시험림 31-37년생 때 0.22~0.27 cm/year, 제3시험림 32-38년생 때 0.28~0.43 cm/year로 시간경과에 따라 간벌효과가 많이 감소하는 경향이었다.
jksfs-111-1-150-g5
Figure 5. Box and whiskers plot for the periodic annual increment of DBH by thinning intensity in each experimental site of Korean white pine plantation. Thinning represents the thinning intensity from first thinning to second thinning. The thinning symbols are the acronym for thinning intensity; H is heavy thinning, M is moderate thinning, L is light thinning, U is un-thinning. Specific thinning treatments were performed according to Table 2. Significant differences between thinning treatments at each measurement are indicated by different letters based on Duncan’s multiple range test (alpha=0.05).
Download Original Figure

이후 2차 간벌이 실시되어 흉고직경 정기평균생장량은 다시 높아졌으며, 해당 시기의 생장량은 제1시험림 37-42년 때 0.29~0.67 cm/year, 제2시험림 37-42년생 때 0.30~0.62 cm/year, 제3시험림 38-43년생 때 0.35~0.44 cm/year로 각 시험림의 표준지간 생장량 차이는 통계적으로 유의하였다(p<0.05). 이와 같이 간벌강도별 흉고직경 생장량의 유의적인 차이는 선행연구의 결과와 일치하였다(Hynynen et al., 2002; Makinen, 2004a; 2004b; Bae et al., 2010; Choi et al., 2014a; Bergh et al., 2014; Rytter and Stener, 2014; Niemisto et al., 2018; Fahlvik et al., 2021).

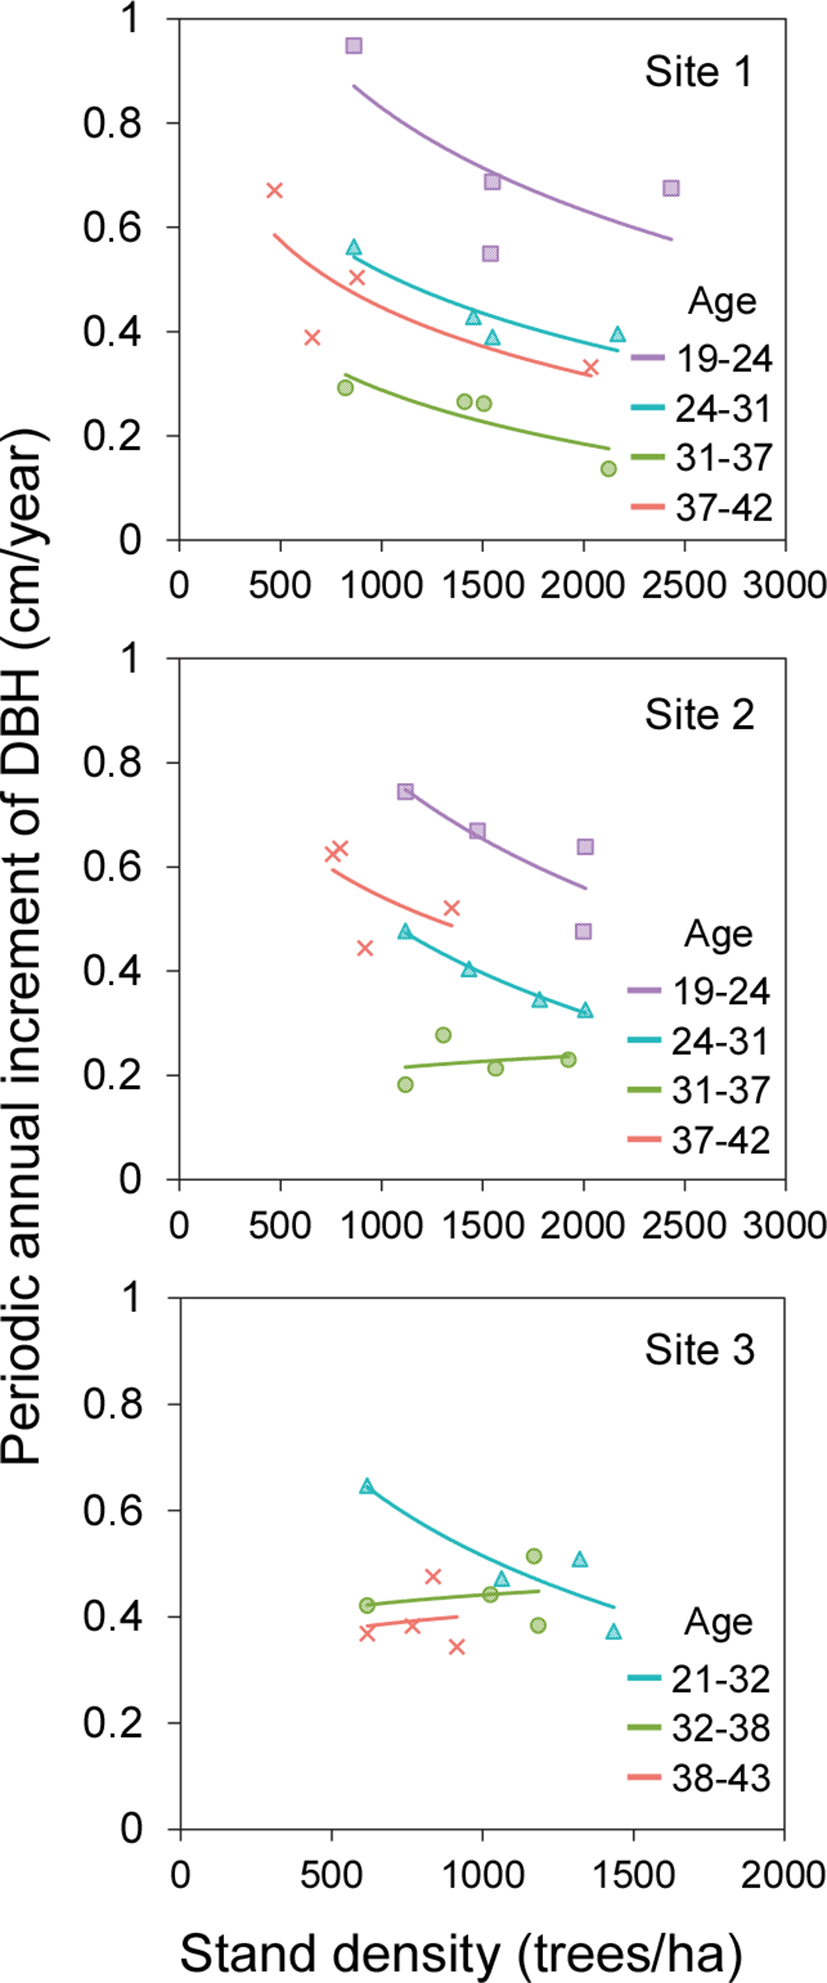
흉고직경 정기평균생장량의 산점도를 도시한 결과, 제1, 2간벌시험림의 간벌구간 생장량 범위는 1차 간벌 직후인 19-24년생 때 0.48~0.95 cm/year, 2차 간벌 직전의 31-37년생 때 0.14~0.29 cm/year로 임령이 증가함에 따라 생장량은 감소하였다(Figure 6). 2차 간벌 이후 37-42년생 때 생장량은 0.33~0.67 cm/year로 다시 증가하였다. 제3간벌시험림의 경우, 1차 간벌 후 21-32년생 때 0.37~0.65 cm/year, 32-38년생 때 0.38~0.51 cm/year로 줄어들었다. 2차 간벌 이후 38-43년생 때 생장량은 0.34~0.48 cm/year로 이전 32-38년생 기간의 생쟝량 수준을 유지하였다.
jksfs-111-1-150-g6
Figure 6. Scatterplots for the periodic annual increment of DBH by stand density at all measurement instances in each experimental site of Korean white pine plantation. The simple regression lines were used to easily illustrate growth trend using the formula of Y=a×ln(X)+b notwithstanding the insufficient number of observations.
Download Original Figure

단순회귀분석의 추세선을 이용하여 간벌효과에 따른 해당 경향을 살펴보면, 각 측정시기별로 임분밀도가 낮을수록 흉고직경 정기평균생장량은 증가하였다(Figure 6). 또한, 임분밀도에 따라 1차 간벌 직후부터 2차 간벌 직전 시기까지 흉고직경 정기평균생장량은 지속적으로 감소하였으나, 2차 간벌 이후 최종 측정시기까지의 생장량은 유지되거나 다시 증가하는 경향이 관측되었다.

3. 개체목재적 생장변화

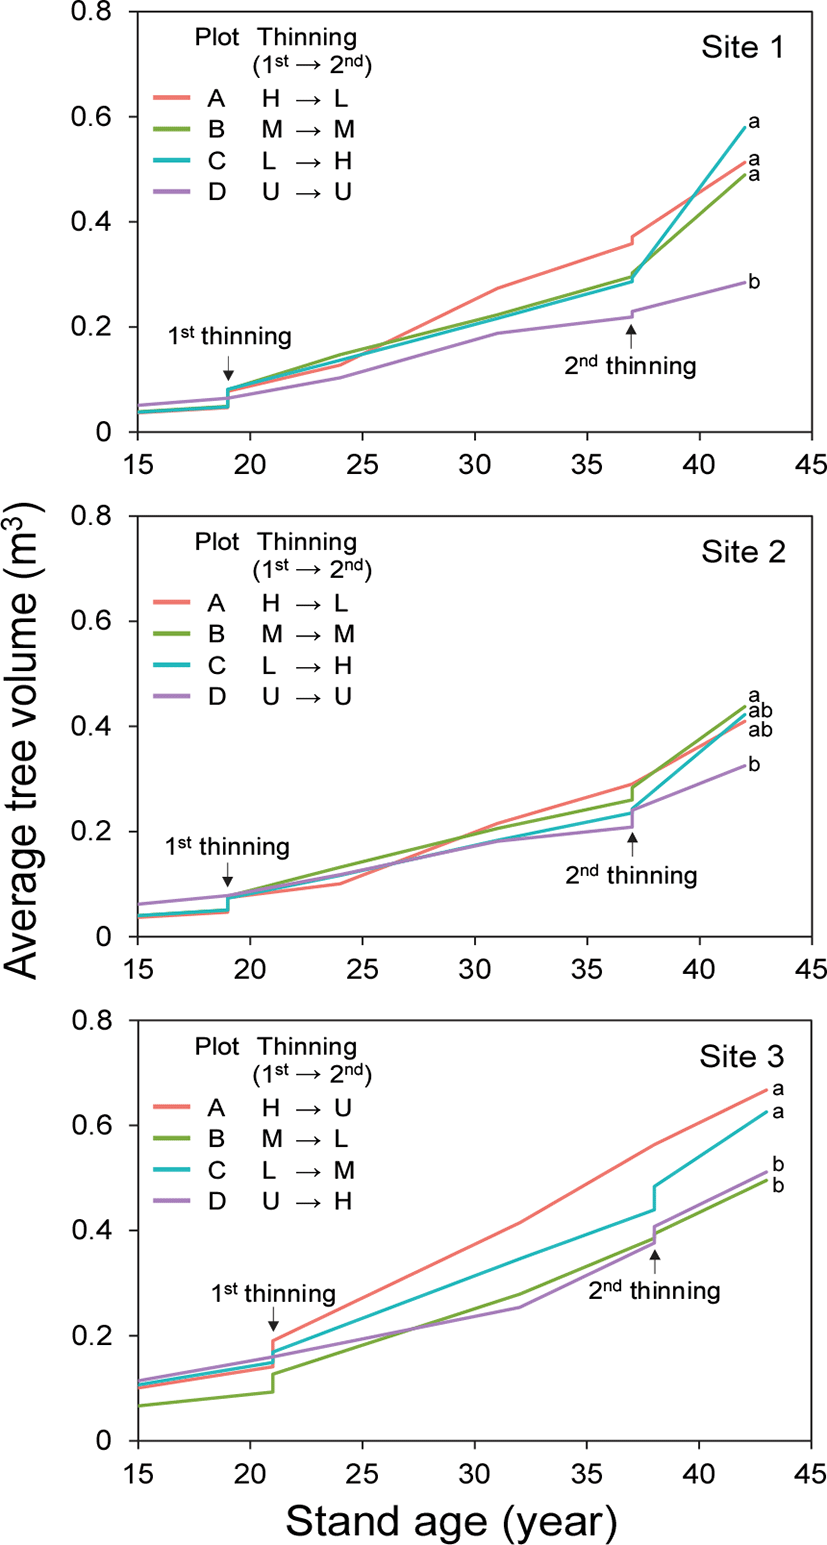
간벌구별 평균 개체목 재적의 범위는 제1, 2간벌시험림에서 19년생 때 0.065~0.081 m3에서 24년생 때 0.104~0.147 m3, 31년생 때 0.182~0.274 m3, 37년생 때(2차 간벌 직후) 0.230~0.372 m3, 42년생 때 0.285~0.580 m3까지 변화하였다. 제3간벌시험림에서는 21년생 때 0.127~0.190 m3, 32년생 때 0.254~0.415 m3, 38년생 때(2차 간벌 직후) 0.394~0.564 m3, 43년생 0.495~0.667 m3로 시간경과에 따른 개체목 재적 변화가 관측되었다(Figure 7).
jksfs-111-1-150-g7
Figure 7. Growth change of average tree volume by thinning intensity in each experimental site of Korean white pine plantation. Thinning represents the thinning intensity from first thinning to second thinning. The thinning symbols are the acronyms for thinning intensity; H is heavy thinning, M is moderate thinning, L is light thinning, U is un-thinning. Specific thinning treatments were performed according to Table 2. Significant differences between thinning treatments at the final measurement are indicated by different letters based on Duncan’s multiple range test (alpha=0.05).
Download Original Figure

시험구간 평균재적의 최대 차이를 살펴보면, 제1, 2간벌시험림의 경우 19년생 때 제1시험림은 0.017 m3, 제2시험림은 0.005 m3였으며, 21년생 때 제3시험림은 0.063 m3로 차이가 크지 않았다. 2차 간벌 직후 37년생 때 제1시험림 0.142 m3, 제2시험림 0.050 m3이었으며, 38년생 때 제3시험림 0.170 m3로 차이가 증가하였다. 최종 조사 시기에 간벌구간 개체목 평균재적의 최대 차이는 제1시험림 0.295 m3, 제2시험림 0.113 m3, 제3시험림 0.172 m3로 더욱 증가하였으며, 이에 대한 시험림별 간벌구간 ANOVA 분석에서 간벌구간 재적차이는 통계적으로 유의하였다(p<0.05).

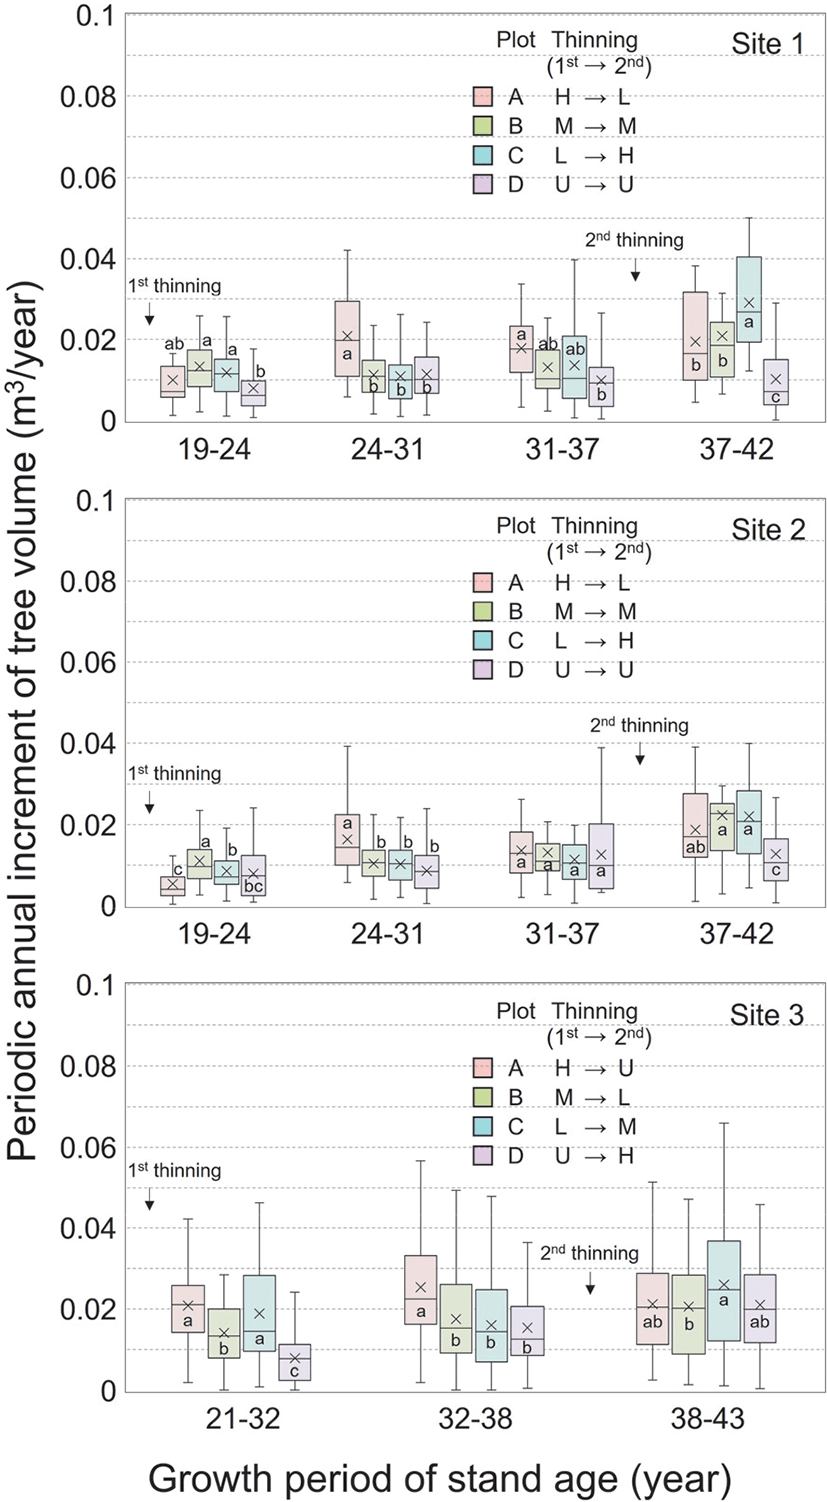
간벌구별 개체목 재적의 정기평균생장량은 간벌강도가 커짐에 따라 증가하였으며, 모든 간벌시험림에서 해당 경향은 2차 간벌 이후에도 지속적으로 나타났다(Figure 8). 그러나 흉고직경 생장량과 달리 재적 생장량은 시간이 경과함에 따라 뚜렷하게 감소하지 않았으며, 임령이 큰 입목의 재적 생장량이 더 큰 것으로 관측되었다. 이는 흉고직경의 1차원적 생장과 달리 재적의 경우 누적 생장된 기존 입목재적에 3차원적으로 생장량이 추가되기 때문으로 사료된다(Jung et al., 2022). 제1, 2시험림의 재적 생장량은 19-24년 때의 0.008~0.013 m3/year이었으며, 최종 측정시기인 37-42년 때 0.010~0.029 m3/year 이었다. 제3시험림의 재적 생장량은 첫 생장기간인 21~32년 때 0.008~0.021 m3/year이었으며, 마지막 생장기간인 38~43년 때 0.020~0.026 m3/year이었다. 이와 같이 시간경과에 따라 간벌구의 재적생장이 증가하는 경향과 간벌강도가 높을수록 재적이 생장하는 결과는 유사 선행연구들의 결과와 일치하였다(Mäkinen and Isomäki, 2004a; 2004b; Wallentin and Nilsson, 2011). 따라서 적정간벌이 목재생산 목적에 부합하는 이용재적량을 더 증대시킬 수 있을 것으로 사료된다.
jksfs-111-1-150-g8
Figure 8. Box and whiskers plot for the periodic annual increment of tree volume by thinning intensity in each experimental site of Korean white pine plantation. Thinning represents the thinning intensity from first thinning to second thinning. The thinning symbols are the acronym for thinning intensity; H is heavy thinning, M is moderate thinning, L is light thinning, U is un-thinning. Specific thinning treatments were performed according to Table 2. Significant differences between thinning treatments at each measurement are indicated by different letters based on Duncan’s multiple range test (alpha=0.05).
Download Original Figure
4. 임분재적 생장변화

임분재적은 간벌률이 높고 임분밀도가 소한 표준지에서 낮았으며, 시간경과에 따른 재적 증가량도 임분밀도 순으로 관측되었다(Figure 9). 제1, 2간벌시험림에서 간벌구별 임분재적의 범위는 19년생 때 67~166 m3/ha, 37년생 때(2차 간벌 직후) 204~488 m3/ha, 42년생 때 273~579 m3/ha이었다. 제3간벌시험림의 경우, 임분재적의 범위는 21년생 때 118~285 m3/ha, 38년생 때(2차 간벌 직후) 313~398 m3/ha, 43년생 때 393~523 m3/ha이었다. 전반적으로 임분재적은 임분밀도가 밀한 표준지에서 더 높았으며 본 결과는 임업선진국에서 주요 침엽수종을 대상으로 간벌에 따른 재적변화를 분석한 선행연구와 일치하였다(Mäkinen and Isomäki, 2004a; 2004b).
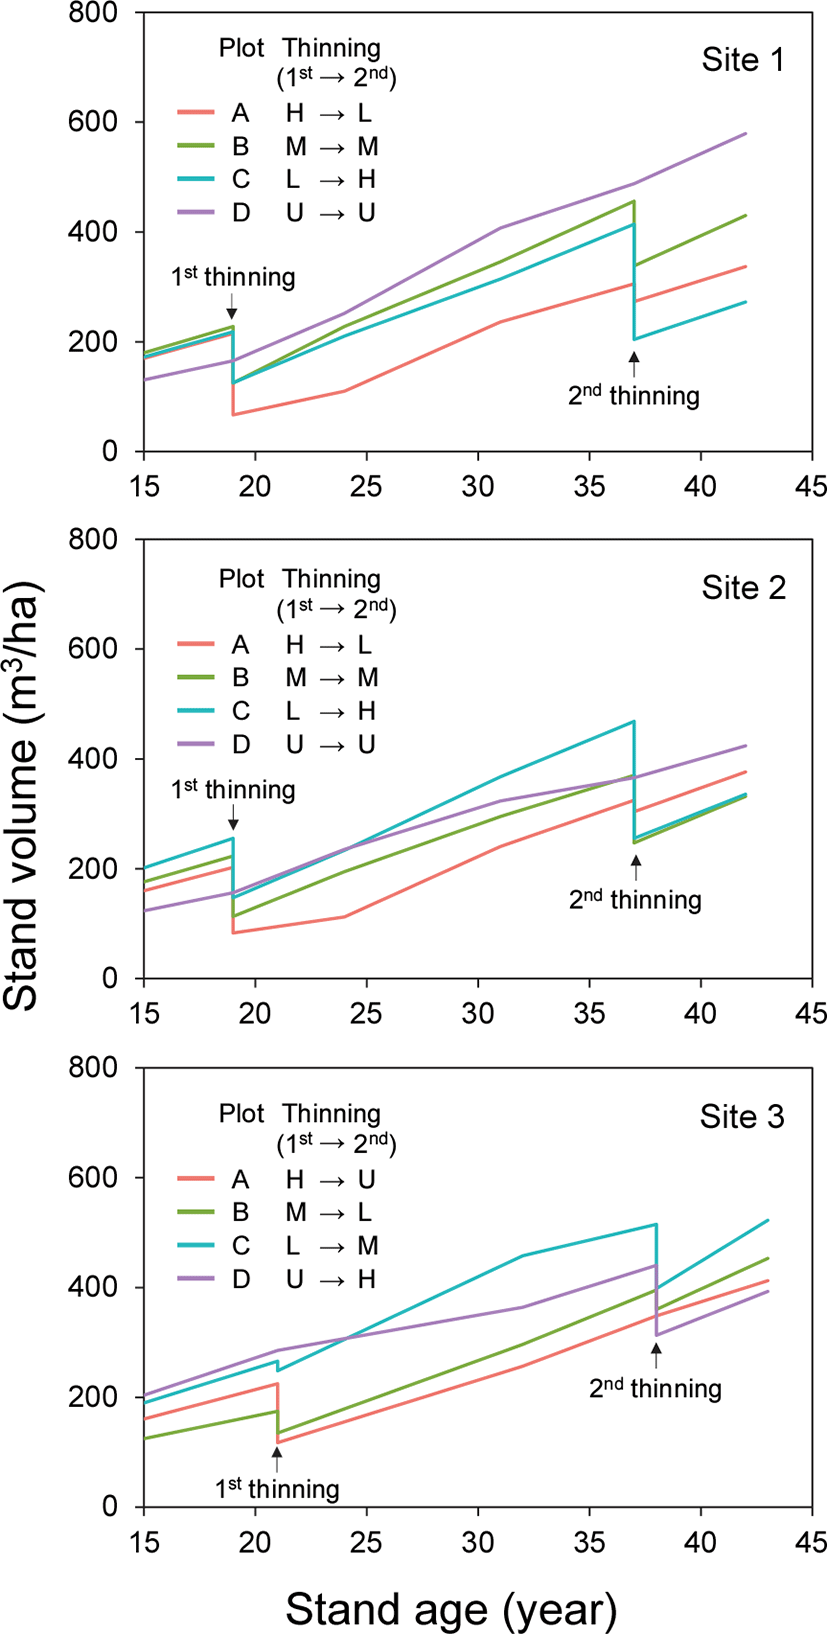
jksfs-111-1-150-g9
Figure 9. Growth change of stand volume per ha by thinning intensity in each experimental site of Korean white pine plantation. Thinning represents the thinning intensity from first thinning to second thinning. The thinning symbols are the acronyms for thinning intensity; H is heavy thinning, M is moderate thinning, L is light thinning, U is un-thinning. Specific thinning treatments were performed according to Table 2.
Download Original Figure

임분재적 정기평균생장량은 전체적으로 6~25 m3·ha−1·year−1 범위로 관측되었는데, 간벌강도 및 임령에 따라 다양하였다(Figure 10). 이 결과는 잣나무의 지위지수 및 임령에 따라 3~8 m3·ha−1·year−1로 제시된 국내 임분수확표와 1~9 m3·ha−1·year−1로 제시된 현실림 임분수확표보다 높았다(Korea Forest Research Institute, 2012b; National Institute of Forest Science, 2016). 하지만, National Institute of Forest Science(2021)은 국내 잣나무 인공림의 간벌시험지를 대상으로 2004~2018년, 2004~2016년, 2010~2020년 사이에 2회 매목조사를 통해 변화된 임분현황을 제시하였는데, 간벌강도, 잔존본수, 임령에 따라 해당 연구의 임분재적 정기평균생장량은 7~24 m3·ha−1·year−1로 분석되었다. 본 연구결과와 선행연구를 종합하면, 임분재적은 임분밀도에 따라서 기존 수확표 상의 정기평균생장량보다 높을 수 있다고 사료된다.
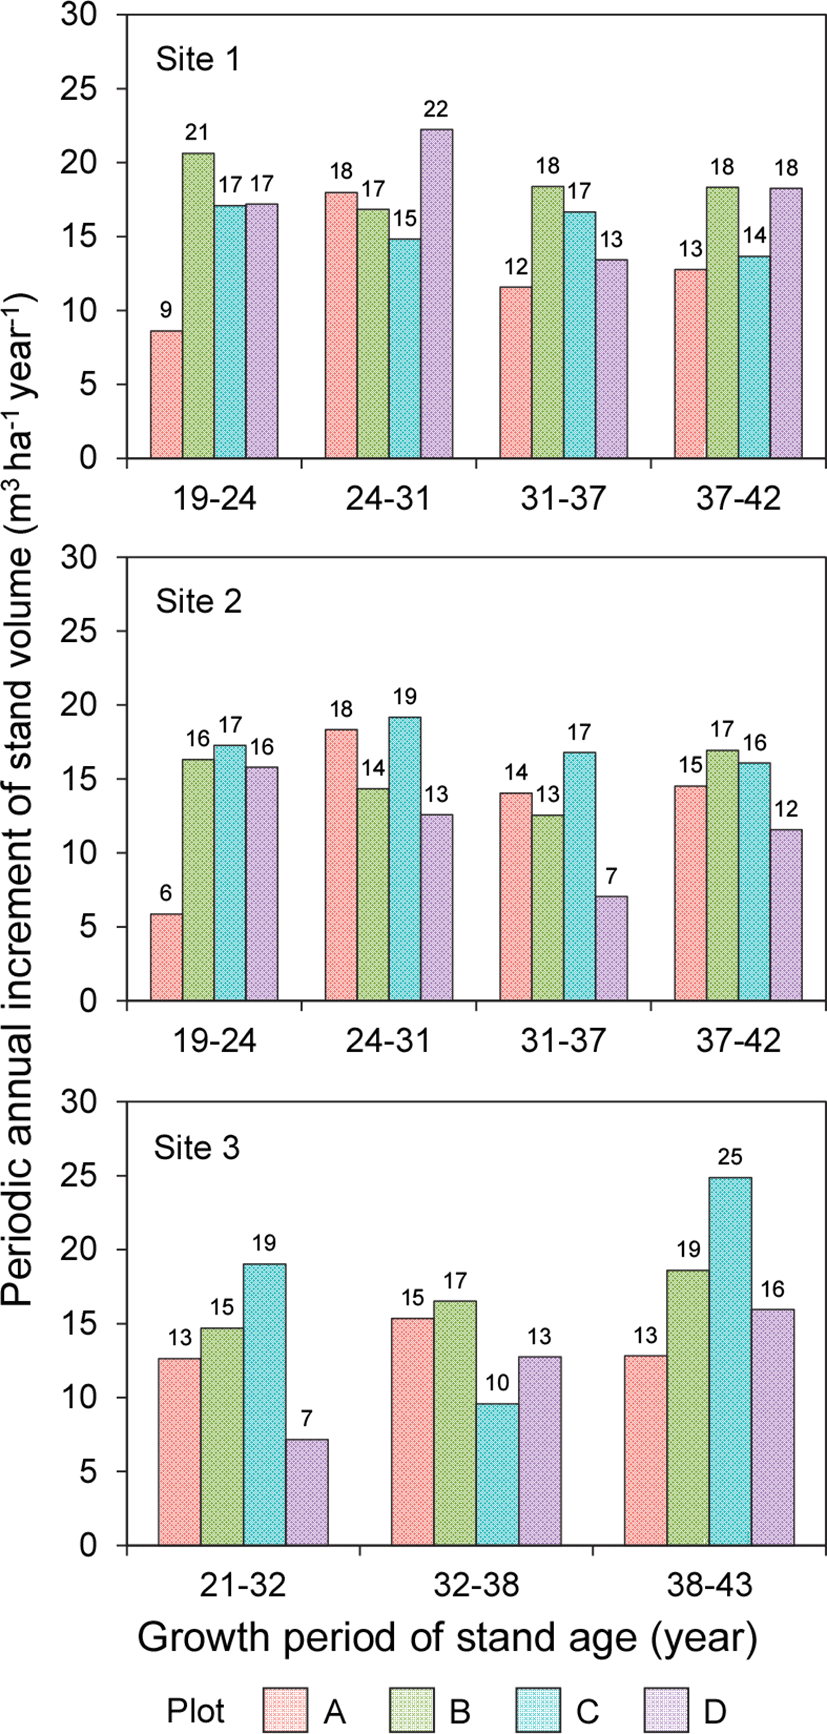
jksfs-111-1-150-g10
Figure 10. Periodic annual increment of stand volume by plot in each experimental site of Korean white pine plantation. Specific thinning treatments by plot were performed according to Table 2.
Download Original Figure

제2시험림 24-37년생 기간과 제3시험림 21-38년생 기간에 무간벌구(Plot D)의 임분재적은 당시 약도간벌구(Plot C)보다 낮았는데, 이는 많은 고사목이 발생함과 임분밀도별 생장차이에 따른 영향으로 파악되었다(Figure 9). 또한, 간벌강도 및 생장시기별 임분재적 정기평균생장량은 전반적으로 강도간벌구에서 낮고 약도 및 중도간벌구의 임분재적 생장량이 높게 관측되었다(Figure 10). Mäkinen and Isomäki(2004b)에 따르면, 전체 총 임분재적은 약도간벌과 무간벌에서 큰 차이가 없을 수 있지만, 무간벌구의 자연고사를 고려하면 최소 약도간벌 수준 이상이 필요하다고 보고하였는데, 본 연구의 제2, 3시험림 임분재적 및 정기평균생장량 분석결과에서도 임분 재적의 최대 증가량을 위해 적정 간벌이 필요한 것으로 파악되었다(Figures 9, 10).

임목생장학 측면에서 간벌에 따른 개체목과 임분재적 변화를 종합하면, 간벌강도가 클수록 임분재적의 총량은 다소 낮을 수 있지만 개체목 재적생장은 촉진되는 것으로 분석되었다(Figures 7, 9). 따라서 일정한 산림경영계획 기간 내 형질이 우수한 대경재 생산을 촉진하기 위해서는 1차 및 2차 간벌의 적정 산림시업이 필요한 것으로 판단된다(Hynynen et al., 2002; Huuskonen and Hynynen, 2006; Huuskonen et al., 2014; Niemistö et al., 2018). 또한, 자연고사로 인한 임목손실을 고려하면 최소 약도간벌 수준 이상의 산림시업이 임분재적 증가량 측면에서도 더욱 용이할 것으로 사료된다(Mäkinen and Isomäki, 2004b). 추후 잔존 입목본수, 임분 흉고단면적, 상대밀도(Relative density), 임분밀도지수(Stand density index), 임목축적도(Stocking percent)와 같은 다양한 밀도진단 및 평가를 통해 임분관리 목표별 최적 산림시업이 제시될 수 있도록 지속적인 연구가 필요하다(Lee and Choi, 2019; 2020; Jung, 2022).

5. 고사목 발생현황

제1, 2시험림의 고사목 발생은 임분밀도가 높았던 무간벌구에서 많이 관측되었다. 특히 전체 누적 고사본수가 간벌구 Plot A, B, C에서 350 본/ha 이하였던 것에 반하여, 무간벌구 Plot D에서는 900 본/ha 이상으로 매우 많이 발생하였다(Figure 11). 이와 같은 경향은 제3간벌시험림에서도 나타났는데, 간벌구 Plot A에서는 고사목 누적본수가 전혀 발생하지 않았던 것에 대비하여, 무간벌구 Plot D에서는 600 본/ha이 발생하였다. 따라서 무간벌구에서 간벌구보다 고사목이 많이 발생한다고 보고한 선행연구들과 본 연구결과가 일치하였다(Mäkinen and Isomäki, 2004a; 2004b; Zhang et al., 2013).
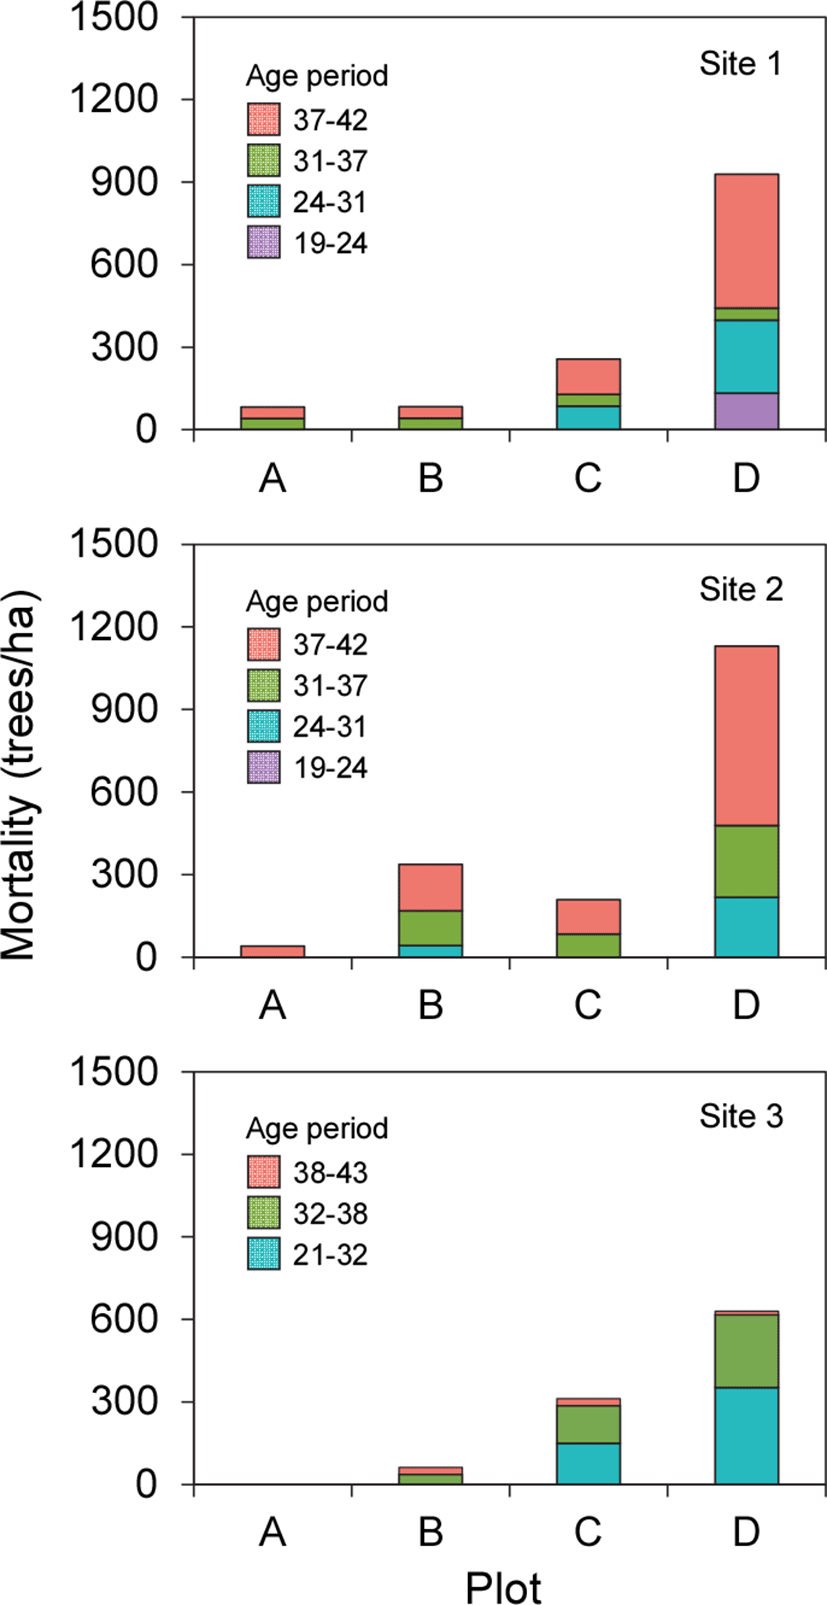
jksfs-111-1-150-g11
Figure 11. Mortality by plot over time in each experimental site of Korean white pine plantation. Specific thinning treatments by plot were performed according to Table 2.
Download Original Figure

특히, 제1,2시험림은 2차 간벌시기에도 Plot D가 무간벌로 유지되었는데, 이에 따라 37-42년생 때 고사목의 발생은 더욱 많았다. 반면에 제3시험림에서는 2차 간벌 시 강도간벌구를 제외한 모든 간벌구에서 간벌이 시행됨에 따라 이후 최종 생장기간인 38-43년생 때 고사목은 거의 발생하지 않았다. 본 연구결과, 고사목 발생은 간벌시업에 따른 임분밀도에 크게 영향을 받는 것으로 사료된다.

결 론

본 연구는 잣나무 인공림을 대상으로 1, 2차 간벌에 따른 생장변화를 분석하였다. 평균 흉고직경은 간벌강도가 강할수록 높았으며, 시간경과에 따른 간벌구별 흉고직경 차이는 크게 나타났다. 임분밀도가 밀한 표준지도 2차 간벌 시 적정 강도로 시행되면 다시 흉고직경이 증대되는 것으로 관측되었다. 흉고직경 정기평균생장량 분석결과, 간벌에 따라 임분밀도가 낮은 표준지에서 더 높은 생장량이 나타났으며, 1차 간벌 후 시간경과에 따른 생장량은 감소하였다. 이후 2차 간벌 시 잔존 임분밀도가 높은 표준지를 강도간벌한 경우, 간벌률에 따라 흉고직경 정기평균생장량은 다시 증가하였다. 수고는 간벌강도에 따른 생장효과가 뚜렷하게 나타나지 않았다.

개체목 평균재적의 경우, 시간경과에 따라 간벌강도간 생장차이가 커지는 경향이 관측되었다. 개체목 평균재적의 정기평균생장량은 간벌강도가 클수록 높았으며, 흉고직경과 달리 시간이 지남에 따라 증가하였다. 2차 간벌에 따른 평균재적 생장량은 강도간벌구에서 더 큰 것으로 분석되었다. 임분재적은 간벌강도가 낮은 표준지에서 시간이 경과할수록 높은 경향이 관측되었으나, 강도간벌구에서 개체목들의 흉고직경 및 재적 생장이 더 높았다. 따라서 이러한 생장특성과 우수형질을 고려하여 단기간 내 우량대경재 생산 목표 시 적정 강도간벌이 필요한 것으로 사료된다. 고사목 발생은 간벌강도가 높을수록 적었으며, 임분밀도가 높은 무간벌구에서 가장 많았다. 본 연구결과, 적정 강도간벌을 실시하여 임분밀도가 조절되면 1차와 2차 간벌에서 모두 개체목들의 흉고직경과 재적 생장은 촉진되는 것을 분석하였다. 간벌률이 낮은 지역일수록 임분 총재적은 높은 경향이었으나, 최소 약도간벌을 실시하는 것이 임분 재적을 더 높게 유지하기도 하였다. 본 연구는 향후 국내 잣나무 인공림의 생장특성을 파악하고 1차 및 2차 간벌에 따른 산림시업 지침을 마련하는데 기초자료로써의 활용이 기대된다.

감사의 글

본 연구는 2022년도 정부(교육부)의 재원으로 한국연구재단 기초연구사업(No. NRF-2016R1D1A1B02011648)의 지원과 산림청(한국임업진흥원) 산림과학기술 연구개발사업(No.2019151D10-2123-0301)의 지원을 받아 수행되었습니다.

References

1.

Amateis, R.L. 2000. Modeling response to thinning in loblolly pine plantations. Southern Journal of Applied Forestry 24(1): 17-22.

2.

Amateis, R.L. and Burkhart, H.E. 2005. The influence of thinning on the proportion of peeler, sawtimber, and pulpwood trees in loblolly pine plantations. Southern Journal of Applied Forestry 29(3): 158-162.

3.

Bae, S.W., Hwang, J.H., Lee, S.T., Kim, H.S. and Jeong, J.M. 2010. Changes in soil temperature, moisture content, light availability and diameter growth after thinning in Korean pine (Pinus koraiensis) plantation. Journal of Korean Society of Forest Science 99(3): 397-403.

4.

Bergh, J., Nilsson, U., Allen, H.L., Johansson, U. and Fahlvik, N. 2014. Long-term responses of Scots pine and Norway spruce stands in Sweden to repeated fertilization and thinning. Forest Ecology and Management 320: 118-128.

5.

Burkhart, H.E., Avery, T.E. and Bullock, B.P. 2019. Forest Measurements, 6th ed. Waveland Press, Inc. Long Grove, IL. pp. 434.

6.

Choi, I.H., Kim, J.H., Ji, B.Y., Shim, W.S. and Kim, H.S. 1996. Establishment of thinning experimental plots of Korean white pine stand(1). Research Bulletin of the Experiment Forests, College of Forestry, Kangwon National University 16: 152-160. (in Korean)

7.

Choi, I.H., Kim, S.K. and Yi, M.J. 1999. Investigation of thinning experimental plots site 3 of Pinus koraiensis Stand(1). Journal of Research Forest of Kangwon National University 19: 104-112. (in Korean)

8.

Choi, I.H., Won, H.K. and Choi, J.K. 2001. Establishment of thinning experimental plots of Korean white pine stand(Ⅲ). Journal of Research Forest of Kangwon National University 21: 142-154. (in Korean)

9.

Choi, I.H. 2003. Income business and outline of the research forest of Kangwon National University. Journal of Research Forest of Kangwon National University 23: 64-79 (in Korean).

10.

Choi, J.K., Hong, S.W., Choi, G.H., Kang, S.H., Hong, S.W., Shin, J.W. and Choi, I.H. 2009. Investigation of permanent sample plots(1),(2),(3) in the artificial stand of Pinus koraiensis(Ⅰ). Journal of Research Forest of Kangwon National University 30: 49-79. (in Korean)

11.

Choi, J.K., Lee, B.K., Choi, B.M., Shin, J.W. and Choi, I.W. 2010. Investigation of thinning experimental plots(1),(2), (3) of Korean white pine stand(1). Journal of Research Forest of Kangwon National University 30: 81-105. (in Korean)

12.

Choi, J.K., Lee, B.K., Lee, D.S. and Choi, I.H. 2014a. Growth monitoring of Korean white pine (Pinus koraiensis) plantation by thinning intensity. Journal of Korean Forest Society 103(3): 422-430. (in Korean with English abstract)

13.

Choi, J.K., Lee, D.S., Seo, Y.W. and Choi, I.H. 2014b. Investigation of thinning experimental plots(1),(2) of Korean white pine stand(Ⅱ). Journal of Research Forest of Kangwon National University 34: 1-26. (in Korean with English abstract)

14.

Choi, J.K., Seo, Y.W. and Lee, D.S. 2015. Investigation of thinning experimental plots(4~10) of Korean white pine plantation(Ⅲ). Journal of Research Forest of Kangwon National University 35: 49-102. (in Korean with English abstract)

15.

Choi, J.K., Lee, D.S., Seo, Y.W., Kim, D.U., Park, J.Y. and Choi I.H. 2016. Investigation of thinning experimental plots(3) of Korean white pine stand(Ⅲ). Journal of Research Forest of Kangwon National University 36: 22-39. (in Korean with English abstract)

16.

Choi, J.K., Lee, D.S. and Han, S.Y. 2019. Investigation of thinning experimental plots(1),(2) of Korean white pine stand(Ⅲ). Journal of Research Forest of Kangwon National University 39: 28-50. (in Korean with English abstract)

17.

Choi, J.K., Jung, S.H., Lee, M.J. and Jin, H.J. 2021. Investigation of thinning experimental plots(3) of Korean white pine stand(Ⅳ). Journal of Research Forest of Kangwon National University 41: 17-28. (in Korean with English abstract)

18.

Fahlvik, N., Rytter, L. and Stener, L.G. 2021. Production of hybrid aspen on agricultural land during one rotation in southern Sweden. Journal of Forestry Research 32(1): 181-189.

19.

Hwang, J.H., Bae, S.W., Lee, K.J., Lee, K.S. and Kim, H.S. 2008. Short-term effect of thinning on aboveground carbon storage in Korean pine (Pinus koraiensis) plantation. Journal of Korean Forest Society 97(6): 605-610 (in Korean with English abstract).

20.

Huuskonen, S. and Hynynen, J. 2006. Timing and intensity of precommercial thinning and their effects on the first commercial thinning in Scots pine stands. Silva Fennica 40(4): 645-662.

21.

Huuskonen, S., Hakala, S., Mäkinen, H., Hynynen, J. and Varmola, M. 2014. Factors influencing the branchiness of young Scots pine trees. Forestry 87(2): 257-265.

22.

Hynynen, J. 1995. Predicting the growth response to thinning for Scots pine stands using individual-tree growth models. Silva Fennica 29(3): 225-246.

23.

Hynynen, J., Ojansuu, R., Hökkä, H., Siipilehto, J., Salminen, H. and Haapala, P., 2002. Models for predicting stand development in MELA system. Finnish Forest Research Institute (Metsäntutkimuslaitos), Research Paper 835. pp. 116.

24.

Hynynen, J., Eerikäinen, K., Mäkinen, H. and Valkonen, S. 2019. Growth response to cuttings in Norway spruce stands under even-aged and uneven-aged management. Forest Ecology and Management 437: 314-323.

25.

Jung, S.H. 2022. A Study on the tree growth by first and second thinning intensity in Korean white pine plantation. M.S. thesis at Graduate School of Kangwon National University, Chuncheon, Korea, p. 82. (in Korean with English abstract)

26.

Jung, S., Seo, Y., Lee, D. and Choi, J. 2022. A study on the growth change by DBH class in Korean white pine plantation. Journal of Korean Society of Forest Science 111(1): 125-135. (in Korean with English abstract)

27.

Kangwon National University. 2020. The 8th Management Plan for Forest Compartment in Research Forest, College of Forest and Environmental Sciences, Kangwon National University. Chuncheon, Korea, pp. 100. (in Korean)

28.

Knoebel, B.R., Burkhart, H.E. and Beck, D.E. 1986. A growth and yield model for thinned stands of yellow-poplar. Forest Science 32(suppl_2): a0001-z0002.

29.

Korea Forest Research Institute. 2005. Standard Manual for Sustainable Forest Resource Management. Korea Forest Research Institute, Seoul, Korea, pp. 289. (in Korean)

30.

Korea Forest Research Institute. 2012a. commercial tree species 3 Pinus koraiensis. pp. 168. (in Korean)

31.

Korea Forest Research Institute. 2012b. Stem Volume, Biomass, and Yield Table. Korea Forest Research Institute, Seoul, Korea. pp. 261. (in Korean).

32.

Korea Forest Research Institute. 2015. Thinning and Target Forest Type. Korea Forest Research Institute, Seoul, Korea, pp. 156. (in Korean)

33.

Korea Forest Service. 2021a. 2021 Statistical Yearbook of Forestry. Korea Forest Service, Daejeon, Korea, pp. 463. (in Korean)

34.

Korea Forest Service. 2021b. Budget Plan in 2021. https://www.forest.go.kr/. (in Korean)

35.

Korea Meteorological Administration. 2021. Annual Climate Value in Korea. https://data.kma.go.kr/. (in Korean)

36.

Lee, D.K., Kwon, K.W., Kim, J.H. and Kim, G.T. 2010. Silviculture. Hyangmunsa, Seoul, Korea, pp. 334. (in Korean)

37.

Lee, D., Seo, Y., Park, J. and Choi, J. 2017a. Thinning intensity for large diameter trees in Korean white pine plantation of South Korea. Journal of Forest and Environmental Science 33(1): 74-77.

38.

Lee, D., Seo, Y. and Choi, J. 2017b. Estimation and validation of stem volume equations for Pinus densiflora, Pinus koraiensis, and Larix kaempferi in South Korea. Forest Science and Technology 13(2): 77-82.

39.

Lee, D. and Choi, J. 2019. Evaluating maximum stand density and size–density relationships based on the competition density rule in Korean pines and Japanese larch. Forest Ecology and Management 446: 204-213.

40.

Lee, D. and Choi, J. 2020. Stocking diagrams for silvicultural guideline in Korean pines and Japanese larch. Forests 11(8): 833.

41.

Mäkinen, H. and Isomäki, A. 2004a. Thinning intensity and growth of Scots pine stands in Finland. Forest Ecology and Management 201(2-3): 311-325.

42.

Mäkinen, H. and Isomäki, A. 2004b. Thinning intensity and growth of Norway spruce stands in Finland. Forestry 77(4): 349-364.

43.

National Institute of Forest Science. 2016. Empirical Yield Table. National Institute of Forest Science, Seoul, Korea. pp. 64. (in Korean).

44.

National Institute of Forest Science. 2021. Growth Monitoring of Empirical Experiments to Foster and Nurture Forest Resources. National Institute of Forest Science, Seoul. pp. 127. (in Korean)

45.

Niemistö, P., Kilpeläinen, H. and Poutiainen, E. 2018. Effect of first thinning type and age on growth, stem quality and financial performance of a Scots pine stand in Finland. Silva Fennica 52(2): 7816.

46.

Nishizono, T., Tanaka, K., Hosoda, K., Awaya, Y. and Oishi, Y. 2008. Effects of thinning and site productivity on culmination of stand growth: results from long-term monitoring experiments in Japanese cedar (Cryptomeria japonica D. Don) forests in northeastern Japan. Journal of Forest Research 13(5): 264-274.

47.

Nyland, R.D. 1996. Silviculture: Concepts and Applications. McGraw-Hill. New York. pp. 633.

48.

Park, J.Y. 2017. A study on growth change by thinning intensity in Pinus koraiensis plantation for large timber production. M.S. thesis at Graduate School of Kangwon National University, Chuncheon, Korea, pp. 53. (in Korean with English abstract)

49.

Pfister, O., Wallentin, C., Nilsson, U. and Ekö, P.-M. 2007. Effects of wide spacing and thinning strategies on wood quality in Norway spruce (Picea abies) stands in southern Sweden. Scandinavian Journal of Forest Research 22(4): 333-343.

50.

Rantala, S. 2011. Finnish Forestry: Practice and Management. Metsäkustannus Oy, Finland.

51.

Rytter, L. and Stener, L.G. 2014. Growth and thinning effects during a rotation period of hybrid aspen in southern Sweden. Scandinavian Journal of Forest Research 29(8): 747-756.

52.

R Core Team, 2019. R: A language and environment for statistical computing. R Foundation for Statistical Computing, Vienna, Austria.

53.

Smith, D.M. 1986. The Practice of Silviculture. 8th. ed. Wiley. New York. pp. 527.

54.

Wallentin, C. and Nilsson, U. 2011. Initial effect of thinning on stand gross stem-volume production in a 33-year-old Norway spruce (Picea abies (L.) Karst.) stand in Southern Sweden. Scandinavian Journal of Forest Research 26(11): 21-35.

55.

Zhang, J., Ritchie, M.W., Maguire, D.A. and Oliver, W.W. 2013. Thinning ponderosa pine (Pinus ponderosa) stands reduces mortality while maintaining stand productivity. Canadian Journal of Forest Research 43(999): 311-320.